wagnerbianchi.com

PostgreSQL Partitioning Automation with pg_partman and pg_cron

junho 29th, 2023 | by: Bianchi | Posted in: PostgreSQL | No Comments »

I recently started a new project at work that demands a log table with a jsonb column. I don’t like to have JSON columns on tables as that sounds like you don’t want to make all that information stored on a JSON document well-normalised (more relations, more columns, etc.) More about JSON Data Type support on PostgreSQL.

Based on that project, we started looking at whether the Table Partitioning on PostgreSQL would make sense due to a log table expected to grow very large once the application starts using it. The PostgreSQL version 13.7 (I know, OK, it’s old and needs a major upgrade 😎 ); it is running on AWS RDS.

The Table Partitioning feature can be thought of as a source for queries to improve performance and as a way to mitigate issues related to data vacuuming, better indexing and some other advantages. The table itself is a simple one, but the data would be a big problem over time and thinking about that, we needed not just partitioning but also a way to automate the partitioning removal and the creation of new ones.

Executing online schema changes on PostgreSQL is still an issue, as no rock-solid tool on the market will execute that for big tables without downtime or considerable overhead. So, we need to start with a partitioned table.

🔥 I could not test the pg-osc due to time restrictions, as I said some days ago when I shared the post with my LinkedIn network. (check my post on LinkedIn).

We need to start with a partitioned table and an automated way to manage partitions along the way; operations like creating new partitions over time and removing old partitions as a subset of the data aren’t needed anymore is a desire. Also, I didn’t want to write that myself in case we already have a consolidated tool available. In the PostgreSQL world, we know, it is always an extension available to perform the job, which is not different in this case.

🎯 The database and table I am going to use here are examples, as, naturally, we can’t publish official material 😉

Table Partitioning Background

PostgreSQL table partitioning is a feature that allows you to divide a large table into smaller ones, more manageable pieces called partitions. Each partition is essentially a separate table that stores a subset of the data based on a specified partitioning strategy or partitioning method. Partitioning can provide significant performance benefits by improving query execution time and simplifying data maintenance.

💡Below, I leave you with a quick but functional, manual declarative partitioning example for labs/dev – not production:

-- partitioned or parent table
drop table if exists log;
create table if not exists log (
  log_entry json,
  dt_entry timestamp,
  primary key(dt_entry)
) partition by range(dt_entry);

-- partitions or child tables
create table if not exists log_part_202307 partition of log
for values from ('2023-07-01 00:00:00') to ('2023-07-31 00:00:00');

create table if not exists log_part_202308 partition of log
for values from ('2023-08-01 00:00:00') to ('2023-08-31 00:00:00');
-- end

🎯 Overall, the benefits of Table Partitioning are below (but not limited to):

  1. Improved Query Performance: Partitioning allows for faster query execution by reducing the amount of data that needs to be scanned. When a query is executed, PostgreSQL’s query planner can eliminate irrelevant partitions based on the query conditions, resulting in more targeted data retrieval and improved performance;
  2. Efficient Data Maintenance: Partitioning simplifies data management tasks, such as archiving or removing old data. Instead of performing these operations on the entire table, you can target specific partitions or child tables, which reduces the time and resources required for data maintenance like when running a manual VACUMM process;
  3. Enhanced Data Loading and Indexing: Partitioning can speed up data loading processes. When inserting new data, PostgreSQL can distribute it across multiple partitions simultaneously, utilising parallelism and improving the overall loading performance. Additionally, partitioning allows for indexing individual partitions, enabling more efficient indexing and enhancing query performance;
  4. Easy Data Retention and Purging: You can easily implement data retention and purging strategies by partitioning data based on time ranges or other relevant criteria. For example, you can create monthly partitions and set up a process to automatically drop or archive older partitions, thus managing data growth and maintaining optimal database performance;
  5. Flexibility in Storage and Indexing: PostgreSQL allows you to store different partitions on separate tablespaces, which enables the use of different storage technologies or configurations based on the specific needs of each partition. Additionally, you can create different indexes on each partition, tailoring indexing strategies to optimise query performance for specific subsets of the data;
  6. Improved Scalability: Partitioning enables horizontal scalability by distributing data across multiple physical disks or servers. By leveraging partitioning alongside techniques like sharding or replication, you can handle larger datasets and achieve higher levels of performance and scalability;
  7. Easier Data Analysis: Partitioning can facilitate data analysis and reporting tasks. By dividing data into logical subsets, you can focus analysis on specific partitions, enhancing query performance and simplifying analytical workflows.

🔥 Most of the above topics pave the way for new blog entries, like improved scalability when creating child tables or partitions over different tablespaces. PostgreSQL table partitioning significantly benefits query performance, data maintenance, scalability, and data analysis. Partitioning optimises database operations by efficiently organising and managing data, improving your PostgreSQL’s overall efficiency and performance.

🎧 A great resource I consumed many times is Postgres.FM episode on Partitioning, I suggest you to listening to: https://postgres.fm/episodes/partitioning.

Enter the pg_partman, a PostgreSQL Extension

The pg_partman extension is available on AWS RDS for PostgreSQL from version 12.5 and newer. When working on the RDS, you don’t need to configure the shared_preload_libraries to add the pg_partman extension, as that is already available for the DBA to issue the CREATE EXTENSION command, using, e.g., the psql client.

For the complete solution presented in this blog, in case you want to follow up and build your own lab, you must also have the pg_cron extension added to the shared_preload_libraries on the parameters group, and a cluster restart is required afterwards.

The parent table must have the PARTITIONED BY with the partition method, you want to apply, and the partman schema should be on the same database as the schema where you have your tables (it can be public as well).

📚 First of all, let’s get the pg_cron extension setup (and restart the cluster):

postgres=> CREATE EXTENSION pg_cron;
CREATE EXTENSION

postgres=> select oid, extname from pg_catalog.pg_extension;
  oid  |  extname
-------+------------
 14287 | plpgsql
 16403 | pg_partman
 17786 | pg_cron
(3 rows)

Let’s start setting up the pg_parttman, connect to your database, create a new schema we will name “partman” (very creative) and install the pg_partman extension.

postgres=> \c bianchi_db
You are now connected to database "bianchi_db" as user "postgres".

bianchi_db=> create schema if not exists partman;
CREATE SCHEMA

bianchi_db=> create extension pg_partman with schema partman;
CREATE EXTENSION

bianchi_db=> select oid, extname from pg_catalog.pg_extension;
  oid  |  extname
-------+------------
 14287 | plpgsql
 18949 | pg_partman
(2 rows)

We already have a log table, but let’s recreate it to avoid any questions regarding this part of the procedure. We will also partition the log table by the dt_entry column calling the partman.create_parent() function.

bianchi_db=> drop table if exists log;
create table if not exists log (
    log_entry json,
    dt_entry timestamp,
    primary key(dt_entry)
) partition by range(dt_entry);
DROP TABLE
CREATE TABLE

bianchi_db=> SELECT partman.create_parent(p_parent_table => 'public.log',
 p_control => 'dt_entry',
 p_type => 'native',
 p_interval=> 'monthly',
 p_premake => 6
);
 create_parent
---------------
 t
(1 row)

The above has an interesting effect on partitioning our log table, as, the p_control points to the column of the table we want to use as a partition key, the p_type is configured to use native partitioning, p_interval we configured it as monthly and requested it to create 6 partitions ahead. If we list our tables now, we can see the following:

bianchi_db=> \d
                  List of relations
 Schema |     Name     |       Type        |  Owner
--------+--------------+-------------------+----------
 public | log          | partitioned table | postgres
 public | log_default  | table             | postgres
 public | log_p2022_12 | table             | postgres
 public | log_p2023_01 | table             | postgres
 public | log_p2023_02 | table             | postgres
 public | log_p2023_03 | table             | postgres
 public | log_p2023_04 | table             | postgres
 public | log_p2023_05 | table             | postgres
 public | log_p2023_06 | table             | postgres
 public | log_p2023_07 | table             | postgres
 public | log_p2023_08 | table             | postgres
 public | log_p2023_09 | table             | postgres
 public | log_p2023_10 | table             | postgres
 public | log_p2023_11 | table             | postgres
 public | log_p2023_12 | table             | postgres
(15 rows)

If you use the \d+, you can see the table’s metadata and the partitions attached. Unfortunately, the results of that command will not be OK to show here on the blog, but you can try it on your side to see not only the partitions but also the boundaries of the partitions.

The Partition Management Automation

As we have everything we need regarding partitioning and partman configuration in place, we now need to schedule a @daily check with the pg_cron help so the partman.run_maintenance_proc() can be called automatically.

postgres=> UPDATE partman.part_config
SET infinite_time_partitions = true,
    retention = '3 months',
    retention_keep_table=false
WHERE parent_table = 'public.log';
SELECT cron.schedule('@daily', $$CALL partman.run_maintenance_proc()$$);
UPDATE 0

If you configure the cron.schedule with @hourly, instead of configuring it with @daily. You can see an example of that being triggered below:

postgres=> \x
Expanded display is on.

postgres=> select command, status, start_time, end_time from cron.job_run_details order by start_time desc limit 5;
-[ RECORD 1 ]-----------------------------------
command    | CALL partman.run_maintenance_proc()
status     | succeeded
start_time | 2023-06-29 18:00:00.076273+00
end_time   | 2023-06-29 18:00:00.996104+00
-[ RECORD 2 ]-----------------------------------
command    | CALL partman.run_maintenance_proc()
status     | succeeded
start_time | 2023-06-29 17:00:00.104716+00
end_time   | 2023-06-29 17:00:00.644784+00
-[ RECORD 3 ]-----------------------------------
command    | CALL partman.run_maintenance_proc()
status     | succeeded
start_time | 2023-06-29 16:00:00.466483+00
end_time   | 2023-06-29 16:00:00.98461+00
-[ RECORD 4 ]-----------------------------------
command    | CALL partman.run_maintenance_proc()
status     | succeeded
start_time | 2023-06-29 15:00:00.213028+00
end_time   | 2023-06-29 15:00:00.421355+00
-[ RECORD 5 ]-----------------------------------
command    | CALL partman.run_maintenance_proc()
status     | succeeded
start_time | 2023-06-29 14:00:00.147603+00
end_time   | 2023-06-29 14:00:00.405463+00

🟢 That’s it. You can check this repository on GitHub for more information about the pg_partman.

References:

https://github.com/pgpartman/pg_partman

https://github.com/citusdata/pg_cron

AddThis Social Bookmark Button

The MariaDB Storage-Engine Independent Column Compression

agosto 2nd, 2021 | by: Bianchi | Posted in: MySQL Tuning | No Comments »

One of the features DBAs have on their sleeves is the compression of the data living on databases. For the MariaDB Server, this is not any different. Among some options, we see available for compressing data and save sometimes a bunch of space, one of them certainly is the Storage-Engine Independent Column Compression, which makes it possible to compress data on the column level.

The motivation to analyse this feature on MariaDB Community Server came by after reading MDEV-22367, which claims that MariaDB should retain tables created with the InnoDB having the ROW_FORMAT=COMPRESSED as read-only by default, as mentioned on the notable changes for the MariaDB 10.6 (InnoDB). So, the Colum Compression appears to be, at the initial moment, an alternative if you want to make the compression a little more granular instead of running your databases with the innodb_read_only_compressed as OFF.

You must understand that compressing the whole table with the InnoDb ROW_FORMAT as COMPRESSED is different from compressing the columns of a table with the Storage-Engine Independent Column Compression.

So, the Storage-Engine Independent Column Compression will help compress columns of tables of one of the following data types: TINYBLOB, BLOB, MEDIUMBLOB, LONGBLOB, TINYTEXT, TEXT, MEDIUMTEXT, LONGTEXT, VARCHAR, and VARBINARY. You only need to worry about adding the COMPRESSED work to the columns, initially, to get it compressed. I would also like to call the attention that you’re pretty much covered if you are using the JSON data type added to the MariaDB Server at its version 10.2.7. The JSON data type is mapped out to the LONGTEXT data type mentioned previously.

Before we start creating tables and adding compression, let’s see system and status variables available:

MariaDB [(none)]> show global variables where variable_name in ('column_compression_threshold','column_compression_zlib_level','column_compression_zlib_strategy','column_compression_zlib_wrap');
+----------------------------------+------------------+
| Variable_name                    | Value            |
+----------------------------------+------------------+
| column_compression_threshold     | 100              |
| column_compression_zlib_level    | 6                |
| column_compression_zlib_strategy | DEFAULT_STRATEGY |
| column_compression_zlib_wrap     | OFF              |
+----------------------------------+------------------+
4 rows in set (0.003 sec)

MariaDB [(none)]> show global status where variable_name in ('Column_compressions','Column_decompressions');
+-----------------------+-------+
| Variable_name         | Value |
+-----------------------+-------+
| Column_compressions   |  0    |
| Column_decompressions |  0    |
+-----------------------+-------+
2 rows in set (0.001 sec)

OK, having said that, let’s create a simple table having three columns and one of them that we are supposed to add compression soon issuing an ALTER TABLE command. All the exercises here will be done using the MariaDB Community Server 10.6.3 on Ubuntu 20.04.2 LTS (mariadb:latest docker image), but the Columnar Compression sed here is supported since MariaDB Server 10.3.2.

CREATE TABLE `t1` (
`a` int(11) NOT NULL AUTO_INCREMENT,
`b` varchar(255) DEFAULT NULL,
`c` blob DEFAULT NULL,
PRIMARY KEY (`a`)
) ENGINE=InnoDB AUTO_INCREMENT=84525 DEFAULT CHARSET=utf8mb4;

Let’s add some rows to the table:

root@e7bc0381525d:/# for i in {01..120176}; do mariadb -e 'INSERT INTO test.t1 set a=null, b=REPEAT('b',255), c=REPEAT('c', 65535);'; done
root@e7bc0381525d:/#

Let’s check the size of the table t1 tablespace:

root@e7bc0381525d:/# mariadb -e 'select count(*) from test.t1'
+----------+
| count(*) |
+----------+
| 120176 |
+----------+
root@e7bc0381525d:/# ls -lh /var/lib/mysql/test
total 12M
-rw-rw---- 1 mysql mysql 67 Aug 2 15:32 db.opt
-rw-rw---- 1 mysql mysql 2.0K Aug 2 17:39 t1.frm
-rw-rw---- 1 mysql mysql 11M Aug 2 18:52 t1.ibd

Let’s add compression to columns b and c:

root@e7bc0381525d:/# mariadb -e 'alter table test.t1 change b b varchar(255) compressed, change c c blob compressed;'

root@e7bc0381525d:/# mariadb -e 'show create table test.t1'
CREATE TABLE `t1` (
 `a` int(11) NOT NULL AUTO_INCREMENT,
 `b` varchar(255) /*!100301 COMPRESSED*/ DEFAULT NULL,
 `c` blob /*!100301 COMPRESSED*/ DEFAULT NULL,
 PRIMARY KEY (`a`)
) ENGINE=InnoDB AUTO_INCREMENT=120620 DEFAULT CHARSET=utf8mb4;
root@e7bc0381525d:/# ls -lh /var/lib/mysql/test
total 4.2M
-rw-rw---- 1 mysql mysql 67 Aug 2 15:32 db.opt
-rw-rw---- 1 mysql mysql 2.0K Aug 2 19:00 t1.frm
-rw-rw---- 1 mysql mysql 4.0M Aug 2 19:00 t1.ibd

Let’s check our status variables:

MariaDB [test]> show global status where variable_name in ('Column_compressions','Column_decompressions');
+-----------------------+-------+
| Variable_name         | Value |
+-----------------------+-------+
| Column_compressions   | 22    |
| Column_decompressions | 22    |
+-----------------------+-------+
2 rows in set (0.001 sec)

So, from 11MB to 4 MB, we’re talking about a compression rate of ~63%. The remaining question here is that this rate can vary considering the size of the tablespace? Maybe you can share your experience by adding your comment – any comments are really welcome.

Attention:

This blog post isn’t to encourage or discourage anything; this is meant to mainly exercise the column compression, which appears to be a good feature and must be more used to offer insights for improving it.


AddThis Social Bookmark Button

MariaDB MaxScale like a Pro: Setting up MaxScale 2.3

agosto 5th, 2019 | by: Bianchi | Posted in: MySQL Tuning | No Comments »

I created this series of blog posts after being worked with the MariaDB MaxScale for many customers. All the points mentioned here reflect my views; I’ll add links to the online docs so we can have an official reference. I intend to share my experiences working with MaxScale; we need more practical documentation so we improve the MaxScale usage and transfer knowledge.

First of all, MaxScale 2.3 release, notes, take a look.

Something you need to know before starting with the praxis here – all instances are running Debian 9.

root@prod-mariadb01:~# lsb_release -a
No LSB modules are available.
Distributor ID:	Debian
Description:	Debian GNU/Linux 9.9 (stretch)
Release:	9.9
Codename:	stretch

MariaDB MaxScale in a nutshell…

The MariaDB MaxScale is an intelligent database proxy which understands SQL language and has a bunch of bundle modules known as routers or services, monitors, filters, etc. After setting up the MaxScale packages, you have access to all bundle modules, as you need only to add a basic configuration file and start the service. Since version 2.1, you don’t need to elaborate a complete configuration file (/etc/maxscale.cnf) to start the service. Once you get a configuration file with the global [maxscale] section and at least one service defined, you can start the MaxScale service.

What are we going to be doing for setting up the MariaDB MaxScale?

  1. Add the MariaDB Official Repository;
  2. Create the needed users on the database servers (you will see soon that I’m considering you already a Master/Slave running environment);
  3. Create the .secrets file so we can encrypt the passwords for the users on the maxscale.cnf;
  4. Create a basic configuration file for MaxScale and start the process;
  5. Run dynamic commands so we can create a monitor (MariaDBMon), the servers, a listener, and link created servers with the monitor and the service.

Moving on…

By chance, you can be running something like below, which is going to give you the global configuration plus the ReadWtiteSplit Router configured as the service to be configured:

#: This is the basic configuration file we can get in place to start maxscale.
#: Notice that we need yet to come back soon to this file so we can add the service 
#: encrypted user password (attention to security matters, no clear text passwords, please)

[maxscale]
threads                     = auto
log_augmentation            = 1
ms_timestamp                = 1

[rwsplit-service]
type                        = service
router                      = readwritesplit
user                        = maxusr
password                    = <add your encrypted maxusr password here>
version_string              = 5.5.50-MariaDB #:should be used with all 10.1 servers and older

As we need SOP or Standard Operational Procedures for everything we perform, the documentation I have for setting up MaxScale considers to always have two users:

  • A service user: no matter how many services/routers you’re running on a MaxScale instance, you need to have at least one user set for the service. The defined user for service is the maxusr (yes, without the “e”, I didn’t forget that). Once you defined that user, you also need to create it on backends so the MaxScale Router/Service can connect to backends and forward queries. In this specific scenario, as we’re speaking about the ReadWriteSplit Router, writes will be sent to the master and reads will be sent to the slaves. You would like to check how the ReadWriteSplit Router Routing Decisions work so you can better design your applications;
  • A monitor user: monitors are modules that monitor the backends, and depending on what you’re running, you will use one monitor or another. If you running a replication cluster, regular GTID Master/Slaves replication, you want to use the MariaDBMon which is going to give you the automatic operations such as failover/rejoin and the manual possibility to perform a switchover;
  • A replication user: as we’re considering a replication cluster, or a yet simple master/slave scenario, we need to have a user so MaxScale can configure replication on database servers when needed. It happens when we configure MaxScale to execute a failover in case the master should crash, we run a manual switchover or yet, a rejoin needs to be executed when the old master comes back to the cluster now as a new slave/replica. If you don’t create a replication user when configuring the MariaDBMon, be aware that the user for your replication will be the one you defined to run the monitor per se, I personally don’t like that (don’t be lazy, 😉 ).

Let’s assume you have a simple Master/Slave already running, like below:

#: master/slave topology
MariaDB MaxScale Servers
--------------------------------------------------------
1. prod_maxscale01 (10.136.87.62/24 - Mode: Active)

MariaDB Servers Backends Cluster
--------------------------------------------------------
2. prod_mariadb01 (10.136.88.50/24 - master)
3. \__ prod_mariadb02 (10.136.69.104/24 - slave/replica)
4. \__ prod_mariadb03 (10.136.79.28/24  - slave/replica)

As a best practice, always configure the @@global.report_host on all database servers with their names:

prod-mariadb01 [(none)]> show slave hosts;
+-----------+----------------+------+-----------+
| Server_id | Host           | Port | Master_id |
+-----------+----------------+------+-----------+
|         3 | prod_mariadb03 | 3306 |         1 |
|         2 | prod_mariadb02 | 3306 |         1 |
+-----------+----------------+------+-----------+
2 rows in set (0.000 sec

Assuming the above MariaDB Servers Backends Cluster already have replication up and running (most of you have an environment like this one), you can just think about how we can add a MaxScale server in the middle of applications and your database servers. Most of the time I’m going to refer to database servers as backends as per the regular terminology we use after adding a Load Balancer to a database topology.

Doing a quick recap on where we are, we need now to create the users on the master, so, we can see users replicating to slaves and have the same data all around. Also, it’s good to have the @@global.gtid_strict_mode set on all the servers so we can keep the binary log files the same on all the servers (MaxScale also likes that).

Below we are creating the users as mentioned before, considering the backends we’re working with:

#: maxscale service user
CREATE USER 'maxusr'@'10.136.%' IDENTIFIED BY '123';
GRANT SELECT ON mysql.user TO 'maxusr'@'10.136.%';
GRANT SELECT ON mysql.db TO 'maxusr'@'10.136.%';
GRANT SELECT ON mysql.tables_priv TO 'maxusr'@'10.136.%';
GRANT SHOW DATABASES ON *.* TO 'maxusr'@'10.136.%';
GRANT SELECT ON mysql.roles_mapping TO maxusr@'10.136.%';

#: maxscale monitor user
CREATE USER 'maxmon'@'10.136.%' IDENTIFIED BY '321';
GRANT RELOAD, SUPER, REPLICATION SLAVE, REPLICATION CLIENT ON *.* TO 'maxmon'@'10.136.%';
GRANT CREATE, SELECT, UPDATE, INSERT, DELETE ON maxscale_schema.* TO 'maxmon'@'10.136.%';

#: replication users  - make sure the below user can connect
#: from all backends to all backends
CREATE USER mariadb@'10.136.%' IDENTIFIED BY '123';
GRANT RELOAD, REPLICATION SLAVE ON *.* TO mariadb@'10.136.%';

One additional detail here is that if you’re running the MariaDB Server 10.3.4 or you upgraded from an older version to a newer one, like MariaDB Server 10.3.5, as the user maxmon has the SUPER privilege, the DELETE HISTORY privilege will also be added to the list of GRANTS due to the fact that user should also be able to delete data from the System Versioned Tables.

After creating the above users, we need to go the prod_maxscale01 – 10.136.87.62 – as we need to set up the MariaDB Official Repository and setup MaxScale packages:

#: setting up the repository
root@prod-maxscale01:~# curl -sS https://downloads.mariadb.com/MariaDB/mariadb_repo_setup | sudo bash
[warning] Found existing file at /etc/apt/sources.list.d/mariadb.list. Moving to /etc/apt/sources.list.d/mariadb.list.old_1.
[info] Repository file successfully written to /etc/apt/sources.list.d/mariadb.list
[info] Adding trusted package signing keys...
Executing: /tmp/apt-key-gpghome.sDa0MNg3Md/gpg.1.sh --keyserver hkp://keys.gnupg.net:80 --recv-keys 0x8167EE24 0xE3C94F49 0xcbcb082a1bb943db 0xf1656f24c74cd1d8 0x135659e928c12247
gpg: key 135659E928C12247: "MariaDB Maxscale <maxscale@googlegroups.com>" not changed
gpg: key F1656F24C74CD1D8: 4 signatures not checked due to missing keys
gpg: key F1656F24C74CD1D8: "MariaDB Signing Key <signing-key@mariadb.org>" not changed
gpg: key CBCB082A1BB943DB: 32 signatures not checked due to missing keys
gpg: key CBCB082A1BB943DB: "MariaDB Package Signing Key <package-signing-key@mariadb.org>" not changed
gpg: key CE1A3DD5E3C94F49: 3 signatures not checked due to missing keys
gpg: key CE1A3DD5E3C94F49: "MariaDB Enterprise Signing Key <signing-key@mariadb.com>" not changed
gpg: key 70E4618A8167EE24: "MariaDBManager" not changed
gpg: Total number processed: 5
gpg:              unchanged: 5
Hit:1 http://security.debian.org stretch/updates InRelease
Ign:2 http://mirrors.digitalocean.com/debian stretch InRelease
Hit:3 https://repos.insights.digitalocean.com/apt/do-agent main InRelease
Get:4 http://mirrors.digitalocean.com/debian stretch-updates InRelease [91.0 kB]
Hit:5 http://downloads.mariadb.com/MariaDB/mariadb-10.4/repo/debian stretch InRelease
Hit:6 http://mirrors.digitalocean.com/debian stretch Release
Ign:7 http://downloads.mariadb.com/MaxScale/2.3/debian stretch InRelease
Hit:8 http://downloads.mariadb.com/Tools/debian stretch InRelease
Hit:10 http://downloads.mariadb.com/MaxScale/2.3/debian stretch Release
Hit:9 https://packagecloud.io/akopytov/sysbench/debian stretch InRelease
Fetched 91.0 kB in 0s (106 kB/s)
Reading package lists... Done
[info] Successfully added trusted package signing keys.

#: setting up packages
root@prod-maxscale01:~# apt install maxscale maxscale-experimental mariadb-client -y
Reading package lists... Done
Building dependency tree
Reading state information... Done
The following NEW packages will be installed:
  maxscale maxscale-experimental
0 upgraded, 2 newly installed, 0 to remove and 5 not upgraded.
Need to get 167 kB/31.1 MB of archives.
After this operation, 143 MB of additional disk space will be used.
Get:1 http://downloads.mariadb.com/MaxScale/2.3/debian stretch/main amd64 maxscale-experimental amd64 2.3.11 [167 kB]
Fetched 167 kB in 0s (337 kB/s)
Selecting previously unselected package maxscale.
(Reading database ... 35953 files and directories currently installed.)
Preparing to unpack .../maxscale_2.3.11_amd64.deb ...
Unpacking maxscale (2.3.11) ...
Selecting previously unselected package maxscale-experimental.
Preparing to unpack .../maxscale-experimental_2.3.11_amd64.deb ...
Unpacking maxscale-experimental (2.3.11) ...
Setting up maxscale (2.3.11) ...
Setting up maxscale-experimental (2.3.11) ...

Why am I setting up the mariadb-client package also? We need to test access from the MaxScale host to the backends so we can make sure MaxScale configured with the users we created will also be able to access backends. To catch permission or access denied when we execute queries is really bad as we need to recap on everything we did for the set up and it can take some time to review everything. We definitely don’t want that. Test access and move on.

Now, let’s create the .secrets and get an encryption version of users passwords:

#: create the .secrets file
root@prod_maxscale01:~# maxkeys
Generating .secrets file in /var/lib/maxscale.

#: generate the encrypted password for maxusr - this is the service user
#: you are going to need the below-encrypted password for the next question
root@prod-maxscale01:~# maxpasswd 123 #: maxusr
A0FE98035CFA5EB978337B739E949878

#: generate the encrypted password for maxmon - this is the monitor user
#: you are going to need the below-encrypted password on next labs
root@prod-maxscale01:~# maxpasswd 321 #: maxmon
AFB909850E7181E9906159CE45176FAD

#: generate the encrypted password for the mariadb replication user
root@prod-maxscale01:~# maxpasswd 123 #: mariadb
A0FE98035CFA5EB978337B739E949878

#: adjust permissions for the .secrets file
root@prod-maxscale01:~# chown maxscale:maxscale /var/lib/maxscale/.secrets

With encrypted passwords, we can create a basic configuration file. The below is your /etc/maxscale.cnf:

[maxscale]
threads                     = auto
log_augmentation            = 1
ms_timestamp                = 1
admin_host                  = 0.0.0.0
admin_port                  = 8989

[rwsplit-service]
type                        = service
router                      = readwritesplit
user                        = maxusr
password                    = A0FE98035CFA5EB978337B739E949878

Check if the maxscale.service is enabled so it can start with the OS boot and start it. Check the log file afterward:

#: starting up the maxscale.service
root@prod-maxscale01:~# systemctl --now enable maxscale.service

root@prod-maxscale01:~# tail -n30 /var/log/maxscale/maxscale.log
MariaDB MaxScale  /var/log/maxscale/maxscale.log  Mon Aug  5 12:25:54 2019
----------------------------------------------------------------------------
2019-08-05 12:25:54   notice : (mxb_log_set_syslog_enabled): syslog logging is enabled.
2019-08-05 12:25:54   notice : (mxb_log_set_maxlog_enabled): maxlog logging is enabled.
2019-08-05 12:25:54.078   notice : (mxb_log_set_highprecision_enabled): highprecision logging is enabled.
2019-08-05 12:25:54.078   notice : (config_load_global): Using up to 976.56KiB of memory for query classifier cache
2019-08-05 12:25:54.079   notice : (change_cwd): Working directory: /var/log/maxscale
2019-08-05 12:25:54.079   notice : (init_sqlite3): The collection of SQLite memory allocation statistics turned off.
2019-08-05 12:25:54.079   notice : (init_sqlite3): Threading mode of SQLite set to Multi-thread.
2019-08-05 12:25:54.080   notice : (main): MariaDB MaxScale 2.3.11 started (Commit: 36355922281a6820de63b76fb76c9203861e3988)
2019-08-05 12:25:54.080   notice : (main): MaxScale is running in process 13166
2019-08-05 12:25:54.080   notice : (main): Configuration file: /etc/maxscale.cnf
2019-08-05 12:25:54.080   notice : (main): Log directory: /var/log/maxscale
2019-08-05 12:25:54.081   notice : (main): Data directory: /var/lib/maxscale
2019-08-05 12:25:54.081   notice : (main): Module directory: /usr/lib/x86_64-linux-gnu/maxscale
2019-08-05 12:25:54.081   notice : (main): Service cache: /var/cache/maxscale
2019-08-05 12:25:54.082   notice : (load_module): Loaded module qc_sqlite: V1.0.0 from /usr/lib/x86_64-linux-gnu/maxscale/libqc_sqlite.so
2019-08-05 12:25:54.082   notice : (qc_setup): Query classification results are cached and reused. Memory used per thread: 976.56KiB
2019-08-05 12:25:54.083   notice : (init): The systemd watchdog is Enabled. Internal timeout = 30s
2019-08-05 12:25:54.083   notice : (config_load_single_file): Loading /etc/maxscale.cnf.
2019-08-05 12:25:54.084   notice : (is_directory): /etc/maxscale.cnf.d does not exist, not reading.
2019-08-05 12:25:54.084   notice : (mxs_get_module_object): Initializing statement-based read/write split router module.
2019-08-05 12:25:54.085   notice : (load_module): Loaded module readwritesplit: V1.1.0 from /usr/lib/x86_64-linux-gnu/maxscale/libreadwritesplit.so
2019-08-05 12:25:54.085   notice : (qc_sqlite_process_init): Statements that cannot be parsed completely are logged.
2019-08-05 12:25:54.086   notice : (service_launch_all): Starting a total of 1 services...
2019-08-05 12:25:54.086   warning: (serviceStartAllPorts): Service 'rwsplit-service' has no listeners defined.
2019-08-05 12:25:54.086   notice : (service_launch_all): Service 'rwsplit-service' started (1/1)
2019-08-05 12:25:54.086   notice : (main): Started REST API on [0.0.0.0]:8989
2019-08-05 12:25:54.086   notice : (main): MaxScale started with 1 worker threads, each with a stack size of 8388608 bytes.
2019-08-05 12:25:54.090   notice : (hkthread): Housekeeper thread started.

Now you have MaxScale up and running! It’s time for testing the maxusr and maxmon connectivity with backends:

#: service user access test
root@prod-maxscale01:~# mysqladmin -u maxusr -p123 -h 10.136.88.50 ping
mysqld is alive
root@prod-maxscale01:~# mysqladmin -u maxusr -p123 -h 10.136.69.104 ping
mysqld is alive
root@prod-maxscale01:~# mysqladmin -u maxusr -p123 -h 10.136.79.28 ping
mysqld is alive

#: monitor user access test
root@prod-maxscale01:~# mysqladmin -u maxmon -p321 -h 10.136.88.50 ping
mysqld is alive
root@prod-maxscale01:~# mysqladmin -u maxmon -p321 -h 10.136.69.104 ping
mysqld is alive
root@prod-maxscale01:~# mysqladmin -u maxmon -p321 -h 10.136.79.28 ping
mysqld is alive

A final test to make sure everything is really set is to test is you can access all databases from all databases. I don’t wanna go over the 9! test here, but, it’s good you go over it and make sure the replication user can access all from all, as replication will be set by MaxScale and you don’t want to have access denied reported by the IO_THREAD for a new slave configured by MaxScale.

At this point, we have MaxScale running with a basic configuration file and also, basic settings for the ReadWriteSplit Router, which is the only service we have running on MaxScale currently. You can notice that we have configurations on the global [maxscale] section for making it possible to remote access MaxScale using the MaxCtrl. Here I’m not considering MaxAdmin as it’s deprecated on MaxScale 2.3 and will be removed on MaxScale 2.4; this latter, currently in beta.

Currently, you can use MaxCtrl to retrieve basic information like below:

#: maxscale global configurations
root@prod-maxscale01:~# maxctrl show maxscale
┌──────────────┬──────────────────────────────────────────────────────────────────────┐
│ Version      │ 2.3.11                                                               │
├──────────────┼──────────────────────────────────────────────────────────────────────┤
│ Commit       │ 36355922281a6820de63b76fb76c9203861e3988                             │
├──────────────┼──────────────────────────────────────────────────────────────────────┤
│ Started At   │ Mon, 05 Aug 2019 12:25:54 GMT                                        │
├──────────────┼──────────────────────────────────────────────────────────────────────┤
│ Activated At │ Mon, 05 Aug 2019 12:25:54 GMT                                        │
├──────────────┼──────────────────────────────────────────────────────────────────────┤
│ Uptime       │ 17863                                                                │
├──────────────┼──────────────────────────────────────────────────────────────────────┤
│ Parameters   │ {                                                                    │
│              │     "libdir": "/usr/lib/x86_64-linux-gnu/maxscale",                  │
│              │     "datadir": "/var/lib/maxscale",                                  │
│              │     "process_datadir": "/var/lib/maxscale/data13166",                │
[...snip...]
│              │     "admin_auth": true,                                              │
│              │     "admin_enabled": true,                                           │
│              │     "admin_log_auth_failures": true,                                 │
│              │     "admin_host": "0.0.0.0",                                         │
│              │     "admin_port": 8989,                                              │
│              │     "admin_ssl_key": "",                                             │
│              │     "admin_ssl_cert": "",                                            │
│              │     "admin_ssl_ca_cert": "",                                         │
│              │     "passive": false,                                                │
[...snip...]
│              │     "load_persisted_configs": true                                   │
│              │ }                                                                    │
└──────────────┴──────────────────────────────────────────────────────────────────────┘

There are lots os commands to retrieve information from MaxScale using the MaxCtrl in communication to the REST API, running now listening on MaxScale host on any interface, as per the `admin_host` variable and on port 8989, as the what is defined at `admin_port`. As we tested the communication with the MaxScale, we can use now MaxCtrl to create the needed objects like a monitor and a listener, add the servers and link them to the monitor and the service. Since MaxScale 2.1 we have a way to do this with Dynamic Commands; the results of the commands will be to create objects and persist them in files created at the –persistdir. Additionally, a journal file will be also kept at the MaxScale –datadir so it can keep track of the current status of the backends in case the maxscale.service is restarted.

Let’s create the cluster, follow the below commands so we can do that:

#: ReadWriteSplit setup Using Dynamic Commands
#: Created by Wagner Bianchi <bianchi@mariadb.com>
#: task: creating the monitor
maxctrl create monitor replication-monitor mariadbmon --monitor-user=maxmon --monitor-password=AFB909850E7181E9906159CE45176FAD replication_user=mariadb replication_password=A0FE98035CFA5EB978337B739E949878

#: task: configuring the monitor for the replication cluster
maxctrl alter monitor replication-monitor monitor_interval          1000 
maxctrl alter monitor replication-monitor failcount                 3 
maxctrl alter monitor replication-monitor auto_failover             true 
maxctrl alter monitor replication-monitor auto_rejoin               true
maxctrl alter monitor replication-monitor enforce_read_only_slaves  true

#: task: create a listener
maxctrl create listener rwsplit-service replication-rwsplit-listener 3306

#: task: create servers
maxctrl create server prod_mariadb01 10.136.88.50  3306
maxctrl create server prod_mariadb02 10.136.69.104 3306
maxctrl create server prod_mariadb03 10.136.79.28  3306

#: task: link servers with the service
maxctrl link service rwsplit-service prod_mariadb01
maxctrl link service rwsplit-service prod_mariadb02
maxctrl link service rwsplit-service prod_mariadb03

#: task: link servers with the monitor
maxctrl link monitor replication-monitor prod_mariadb01
maxctrl link monitor replication-monitor prod_mariadb02
maxctrl link monitor replication-monitor prod_mariadb03

If you executed the above commands while tailing the maxscale.log, you would see many interesting things. At this point, it’s ready to go:

root@prod-maxscale01:~# maxctrl list servers
┌────────────────┬───────────────┬──────┬─────────────┬─────────────────┬──────────────┐
│ Server         │ Address       │ Port │ Connections │ State           │ GTID         │
├────────────────┼───────────────┼──────┼─────────────┼─────────────────┼──────────────┤
│ prod_mariadb03 │ 10.136.79.28  │ 3306 │ 0           │ Slave, Running  │ 0-1-3        │
├────────────────┼───────────────┼──────┼─────────────┼─────────────────┼──────────────┤
│ prod_mariadb02 │ 10.136.69.104 │ 3306 │ 0           │ Slave, Running  │ 0-1-3        │
├────────────────┼───────────────┼──────┼─────────────┼─────────────────┼──────────────┤
│ prod_mariadb01 │ 10.136.88.50  │ 3306 │ 0           │ Master, Running │ 0-1-3        │
└────────────────┴───────────────┴──────┴─────────────┴─────────────────┴──────────────┘

To conclude this blog post, we can do a final test, a sysbench on maxscale server:

root@prod-maxscale01:~# mysql -u bianchi -p123 -h 10.136.87.62 -e "create database maxscaledb" -vvv
--------------
create database maxscaledb
--------------

Query OK, 1 row affected (0.002 sec)

Bye

root@prod-maxscale01:~# sysbench --test=/usr/share/sysbench/oltp_read_write.lua --table_size=10000 --mysql-db=maxscaledb --tables=20 --mysql-user=bianchi --mysql-password=123 --mysql-port=3306 --mysql-host=10.136.87.62 --db-driver=mysql --threads=32 --events=0 --time=60 --rand-type=uniform --report-interval=1 prepare
sysbench 1.0.17 (using bundled LuaJIT 2.1.0-beta2)

Initializing worker threads...

Creating table 'sbtest15'...
Creating table 'sbtest17'...
Creating table 'sbtest16'...
Creating table 'sbtest14'...
[...snip...]
Creating a secondary index on 'sbtest19'...
Creating a secondary index on 'sbtest20'...
Creating a secondary index on 'sbtest16'...
Creating a secondary index on 'sbtest11'...
Creating a secondary index on 'sbtest14'...

root@prod-maxscale01:~# sysbench --test=/usr/share/sysbench/oltp_read_write.lua --table_size=10000 --mysql-db=maxscaledb --tables=20 --mysql-user=bianchi --mysql-password=123 --mysql-port=3306 --mysql-host=10.136.87.62 --db-driver=mysql --threads=32 --events=0 --time=60 --rand-type=uniform --report-interval=1 run &
[1] 15656

root@prod-maxscale01:~# maxctrl list servers
┌────────────────┬───────────────┬──────┬─────────────┬─────────────────┬──────────┐
│ Server         │ Address       │ Port │ Connections │ State           │ GTID     │
├────────────────┼───────────────┼──────┼─────────────┼─────────────────┼──────────┤
│ prod_mariadb03 │ 10.136.79.28  │ 3306 │ 32          │ Slave, Running  │ 0-1-8144 │
├────────────────┼───────────────┼──────┼─────────────┼─────────────────┼──────────┤
│ prod_mariadb01 │ 10.136.88.50  │ 3306 │ 32          │ Master, Running │ 0-1-8144 │
├────────────────┼───────────────┼──────┼─────────────┼─────────────────┼──────────┤
│ prod_mariadb02 │ 10.136.69.104 │ 3306 │ 32          │ Slave, Running  │ 0-1-8144 │
└────────────────┴───────────────┴──────┴─────────────┴─────────────────┴──────────┘

Next blog, I will carry on with this same environment as per what was defined here, I will test failover, switchover, and rejoin.

AddThis Social Bookmark Button

MaxScale HA with Keepalived (CentOS/RedHat 7++)

março 29th, 2019 | by: Bianchi | Posted in: Data Infrastructure, MariaDB Maxscale | No Comments »

This document aims to guide you through the implementation of what we call here as being the MaxScale HA with Keepalived. To introduce the subject and keep it as simple as possible, the keepalived is routing software written in C. Its main goal is to provide simple and robust facilities for load-balancing and provide high availability to environments, having the kernel module operating on layer4 (transport, TCP). Also, to be a faster layer than layer7, keepalived implementing its protocol which is the VRRP, will move the VIP between the configured interfaces so systems can continue accessing the same IP while using another underlying resource.

VRRP specifies an election protocol that dynamically assigns responsibility for a virtual router to one of the VRRP routers on a LAN. The VRRP router controlling the IP address(es) associated with a virtual router is called the Master and forwards packets sent to these IP addresses. The election process provides dynamic failover in the forwarding responsibility should the Master become unavailable. It allows any of the virtual router IP addresses on the LAN to be used as the default first hop router by end-hosts. The advantage gained from using VRRP is a higher availability default path without requiring configuration of dynamic routing or router discovery protocols on every end-host.” [rfc2338]

Before going further:

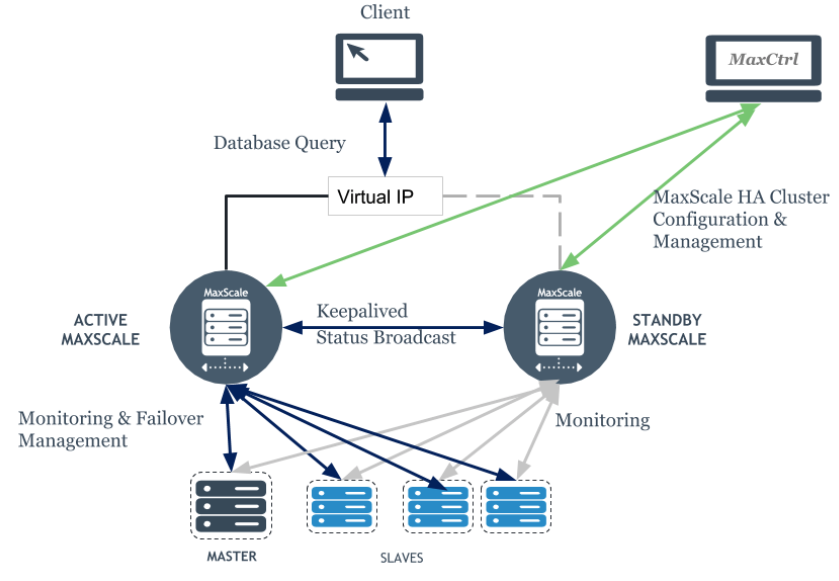
The solution’s big picture:

Screen Shot 2019-03-29 at 15.30.15

This document assumes you already have a set of MaxScale servers running, and you are going over the keepalived implementation (another document should be linked here to cover the MaxScale setup). Below you will see the backend IPs and the VIP to be configured on keepalived is 10.0.0.100, as you see later. The MaxScale server’s IPs are both 10.0.0.11 (box01) and 10.0.0.12 (box02).

#: My current environment has the below Replication Cluster
[root@box01 ~]# maxctrl list servers
┌────────┬───────────┬──────┬─────────────┬─────────────────┬──────┐
│ Server │ Address   │ Port │ Connections │ State           │ GTID │
├────────┼───────────┼──────┼─────────────┼─────────────────┼──────┤
│ box03  │ 10.0.0.13 │ 3306 │ 0           │ Master, Running │      │
└────────┴───────────┴──────┴─────────────┴─────────────────┴──────┘
│ box04  │ 10.0.0.14 │ 3306 │ 0           │ Slave, Running  │      │
└────────┴───────────┴──────┴─────────────┴─────────────────┴──────┘
│ box05  │ 10.0.0.15 │ 3306 │ 0           │ Slave, Running  │      │
└────────┴───────────┴──────┴─────────────┴─────────────────┴──────┘

Also, we consider the MaxScale version is 2.3++, and you already have dedicated configurations for the REST API port listening on a dedicated IP or over all the IPs. Below you can see what is recommended for the MaxScale global configurations on all the MaxScale instances you are going to work with.

[maxscale]
threads          = auto
log_augmentation = 1
ms_timestamp     = 1
syslog           = 1
admin_host       = 0.0.0.0 #: REST API on all interfaces - add a more restrictive valur if possible
admin_port       = 8989    #: The REST API port - add a more restrictive value if possible

Special attention to SELinux, permissive or disabled is the best status for that. If a customer is using that, they will be able to provide a new target configuration for MaxScale and keepalived. This can be a big problem as keepalived will be using ephemeral ports and executing lots of scripts.

The steps this document goes through are below:

  • Recognize the environment, knowing what hosts are currently dedicated to MaxScale;
  • Packages installation, keepalived, and kernel-headers;
  • Add configuration files for keepalived and the maxping.sh;
  • Add the required user to execute scripts on behalf of keepalived;
  • Configure Keepalived and MaxScale to start on boot;
  • Monitor the syslog to observe the transitions.

Recognize the environment

It’s important to recognize the environment, and list the IPs; you can use the hosts’ file to set up a local DNS in case you don’t have very complicated hostnames, set up the SSH key-based authentication between MaxScale hosts, and make sure you have rsync and maxctrl available to work with. Maxctrl is already part of the package as one of the requirements here is to be running MaxScale 2.3++. The rsync package should be set up in case it’s not, and the rsync port (873) should also be observed from the firewall standpoint. With this, we can move on.

Packages installation on all MaxScale instances

One of the things to observe here is that most of the customer does not have access to the internet configured on the servers and then, a wget is suggested to test it:

[root@box01 ~]# wget --spider http://www.google.com
Spider mode enabled. Check if remote file exists.
--2019-03-06 20:41:42-- http://www.google.com/
Resolving www.google.com (www.google.com)... 172.217.162.164, 2800:3f0:4004:800::2004
Connecting to www.google.com (www.google.com)|172.217.162.164|:80... connected.
HTTP request sent, awaiting response... 200 OK
Length: unspecified [text/html]
Remote file exists and could contain further links,
but recursion is disabled -- not retrieving.

As you can see, the 200 is the HTTP response, so, we have access to the internet and we can set up the below packages:

$ yum install curl gcc openssl-devel libnl3-devel net-snmp-devel kernel-headers kernel-devel mailx keepalived -y

Add configuration files for keepalived and the maxping.sh

You can see below the configuration files for the MASTER and for the BACKUP sides, considering we have 2 MaxScale instances (if three, one MASTER and two BACKUP) and the maxping.sh which is a little script that demands a little customization so we can ask keepalived user to execute that script to check if it can list servers through maxctrl and recognize servers names by their names, so, the script executes with no errors passing the exit 0 messages to keepalived back which keep the current server as MASTER. Keeping the current server as master means that keepalived will keep the VIP on MASTER on the configured interface.

You need to pay attention here to the fact that, one server will operate as MASTER and the other one as BACKUP. Don’t add both as MASTER and with the same priority, that’s why I’m considering two configuration files below.

#: /etc/keepalived/keepalived.conf (for the MASTER MaxScale)
global_defs {
  notification_email {
    customer@domain.com
  }
  notification_email_from box01@maxscaleservers
  smtp_server smtp.domain.com:25
  smtp_connect_timeout 30
}
 
vrrp_script chk_myscript {
  script "/usr/local/mariadb_rdba/maxping.sh"
  interval 2
  fall 2
  rise 2
}
 
vrrp_instance VI_1 {
  state MASTER
  interface eth1
  virtual_router_id 51
  priority 101
  advert_int 1
  smtp_alert
  enable_script_security
    authentication {
      auth_type PASS
      auth_pass C97;*V69
    }
 
    virtual_ipaddress {
      10.0.0.100/24
    }
 
    track_script {
      chk_myscript
    }
notify /usr/local/mariadb_rdba/maxify.sh
}

Attention to the below BACKUP host configuration:

#: /etc/keepalived/keepalived.conf (for the BACKUP MaxScale)
global_defs {
  notification_email {
    customer@domain.com
  }
  notification_email_from box01@maxscaleservers
  smtp_server smtp.domain.com:25
  smtp_connect_timeout 30
}
 
vrrp_script chk_myscript {
  script "/usr/local/mariadb_rdba/maxping.sh"
  interval 2
  fall 2
  rise 2
}
 
vrrp_instance VI_1 {
  state BACKUP
  interface eth1
  virtual_router_id 51
  priority 100
  advert_int 1
  smtp_alert
  enable_script_security
  authentication {
    auth_type PASS
    auth_pass C97;*V69
  }
 
  virtual_ipaddress {
    10.0.0.100/24
  }
 
  track_script {
    chk_myscript
  }
notify /usr/local/mariadb_rdba/maxify.sh
}

Below is a small script executed by the keepalived (which has a user for that) which will be querying the server’s list out of MaxScale using the MaxCtrl client program, through the REST API configured to respond on port 8989, and will return the exit 0. This way, the MASTER role is kept. Otherwise, a new transition starts. Attention to the below script’s comments.

#!/bin/bash
 
#: /usr/local/mariadb_rdba/maxping.sh - don't execute this below script with root user or, 
#: execute and remove the /tmp/maxping.txt before starting the keepalived.service officially
#: avoid the syslog entry "exited with status 3"
 
fileName="/tmp/maxping.txt"
rm $fileName
timeout 2s maxctrl list servers &gt; $fileName
to_result=$?
if [ "$to_result" -ge 1 ]; then
    echo Timed out or error, timeout returned $to_result
    exit 3
else
    echo MaxCtrl success, rval is $to_result
    echo Checking maxadmin output sanity
 
    #: here you need to change/add to your servers names
    #: so that can be filtered out of the grep command
    grep1=$(grep box03 $fileName) #: my current master
    grep2=$(grep box04 $fileName) #: my slave01
    grep3=$(grep box05 $fileName) #: my slave02
 
    if [ "$grep1" ] &amp;&amp; [ "$grep2" ] &amp;&amp; [ "$grep3" ]; then
         echo All is fine
         exit 0
    else
        echo Something is wrong
        exit 3
    fi
fi

Adjust permissions:

chmod u+x /usr/local/mariadb_rdba/maxping.sh
chown keepalived_script:root /usr/local/mariadb_rdba/maxping.sh

The above script can for sure be improved, but, it fine does what it promises.

Add the required user to execute scripts on behalf of keepalived on all MaxScale instances

$ useradd -U -M -s /sbin/nologin keepalived_script

Configure Keepalived and MaxScale to start on boot

$ systemctl enable keepalived.service
$ systemctl start keepalived.service
$ systemctl status keepalived.service | grep active
 
$ systemctl enable maxscale.service
$ systemctl start maxscale.service
$ systemctl status maxscale.service | grep active

After starting up the keepalived service, you can assess the VIP on the MASTER side, knowing that the MASTER will be the host with the keepalived configurations with the lowest priority. Below you can notice that I’m using the value configured at the interface parameter, th1 to filter results so we can see better the VIP added to that interface on MASTER:

[root@box01 ~]# ip addr | grep eth1
3: eth1: &lt;BROADCAST,MULTICAST,UP,LOWER_UP&gt; mtu 1500 qdisc pfifo_fast state UP group default qlen 1000
inet 10.0.0.11/24 brd 10.0.0.255 scope global noprefixroute eth1
inet 10.0.0.100/32 scope global eth1

Now you can ping the VIP:

[root@box01 ~]# ping -c 10 10.0.0.100
PING 10.0.0.100 (10.0.0.100) 56(84) bytes of data.
64 bytes from 10.0.0.100: icmp_seq=1 ttl=64 time=0.028 ms
64 bytes from 10.0.0.100: icmp_seq=2 ttl=64 time=0.026 ms
64 bytes from 10.0.0.100: icmp_seq=3 ttl=64 time=0.037 ms
64 bytes from 10.0.0.100: icmp_seq=4 ttl=64 time=0.038 ms
64 bytes from 10.0.0.100: icmp_seq=5 ttl=64 time=0.029 ms
64 bytes from 10.0.0.100: icmp_seq=6 ttl=64 time=0.030 ms
64 bytes from 10.0.0.100: icmp_seq=7 ttl=64 time=0.030 ms
64 bytes from 10.0.0.100: icmp_seq=8 ttl=64 time=0.036 ms
64 bytes from 10.0.0.100: icmp_seq=9 ttl=64 time=0.031 ms
64 bytes from 10.0.0.100: icmp_seq=10 ttl=64 time=0.028 ms
 
--- 10.0.0.100 ping statistics ---
10 packets transmitted, 10 received, 0% packet loss, time 9025ms
rtt min/avg/max/mdev = 0.026/0.031/0.038/0.005 ms

And also test the access to the backends through MaxScale:

[root@box01 ~]# mysqladmin -umaxmon -p321 -h10.0.0.100 ping
mysqld is alive

PS: maxmon is a user I always use on my setups for the MaxScale GaleraMon/MariaDBMon.

Monitor the syslog to observe the transitions

Syslog is your friend in this scenario after and tailing it you can see the transitions, when the IP is attached/detached to/from interfaces:

#: starting the MASTER keepalived
Mar 6 21:09:47 box01 systemd: Starting LVS and VRRP High Availability Monitor...
Mar 6 21:09:47 box01 Keepalived[29208]: Starting Keepalived v1.3.5 (03/19,2017), git commit v1.3.5-6-g6fa32f2
Mar 6 21:09:47 box01 Keepalived[29208]: Opening file '/etc/keepalived/keepalived.conf'.
Mar 6 21:09:47 box01 systemd: PID file /var/run/keepalived.pid not readable (yet?) after start.
Mar 6 21:09:47 box01 Keepalived[29209]: Starting Healthcheck child process, pid=29210
Mar 6 21:09:47 box01 Keepalived[29209]: Starting VRRP child process, pid=29211
Mar 6 21:09:47 box01 systemd: Started LVS and VRRP High Availability Monitor.
Mar 6 21:09:47 box01 Keepalived_healthcheckers[29210]: Opening file '/etc/keepalived/keepalived.conf'.
Mar 6 21:09:47 box01 Keepalived_vrrp[29211]: Registering Kernel netlink reflector
Mar 6 21:09:47 box01 Keepalived_vrrp[29211]: Registering Kernel netlink command channel
Mar 6 21:09:47 box01 Keepalived_vrrp[29211]: Registering gratuitous ARP shared channel
Mar 6 21:09:47 box01 Keepalived_vrrp[29211]: Opening file '/etc/keepalived/keepalived.conf'.
Mar 6 21:09:47 box01 Keepalived_vrrp[29211]: Truncating auth_pass to 8 characters
Mar 6 21:09:47 box01 Keepalived_vrrp[29211]: VRRP_Instance(VI_1) removing protocol VIPs.
Mar 6 21:09:47 box01 Keepalived_vrrp[29211]: Using LinkWatch kernel netlink reflector...
Mar 6 21:09:47 box01 Keepalived_vrrp[29211]: VRRP sockpool: [ifindex(3), proto(112), unicast(0), fd(10,11)]
Mar 6 21:09:47 box01 Keepalived_vrrp[29211]: VRRP_Script(chk_myscript) succeeded
Mar 6 21:09:48 box01 Keepalived_vrrp[29211]: VRRP_Instance(VI_1) Transition to MASTER STATE
Mar 6 21:09:49 box01 Keepalived_vrrp[29211]: VRRP_Instance(VI_1) Entering MASTER STATE
Mar 6 21:09:49 box01 Keepalived_vrrp[29211]: VRRP_Instance(VI_1) setting protocol VIPs.
Mar 6 21:09:49 box01 Keepalived_vrrp[29211]: Sending gratuitous ARP on eth1 for 10.0.0.100
Mar 6 21:09:49 box01 Keepalived_vrrp[29211]: VRRP_Instance(VI_1) Sending/queueing gratuitous ARPs on eth1 for 10.0.0.100
Mar 6 21:09:49 box01 Keepalived_vrrp[29211]: Sending gratuitous ARP on eth1 for 10.0.0.100
Mar 6 21:09:49 box01 Keepalived_vrrp[29211]: Remote SMTP server [177.185.201.253]:25 connected.
 
#: starting the BACKUP keepalived
Mar 6 21:10:35 box02 systemd: Starting LVS and VRRP High Availability Monitor...
Mar 6 21:10:35 box02 Keepalived[27512]: Starting Keepalived v1.3.5 (03/19,2017), git commit v1.3.5-6-g6fa32f2
Mar 6 21:10:35 box02 Keepalived[27512]: Opening file '/etc/keepalived/keepalived.conf'.
Mar 6 21:10:35 box02 systemd: PID file /var/run/keepalived.pid not readable (yet?) after start.
Mar 6 21:10:35 box02 Keepalived[27513]: Starting Healthcheck child process, pid=27514
Mar 6 21:10:35 box02 Keepalived[27513]: Starting VRRP child process, pid=27515
Mar 6 21:10:35 box02 systemd: Started LVS and VRRP High Availability Monitor.
Mar 6 21:10:35 box02 Keepalived_vrrp[27515]: Registering Kernel netlink reflector
Mar 6 21:10:35 box02 Keepalived_vrrp[27515]: Registering Kernel netlink command channel
Mar 6 21:10:35 box02 Keepalived_vrrp[27515]: Registering gratuitous ARP shared channel
Mar 6 21:10:35 box02 Keepalived_vrrp[27515]: Opening file '/etc/keepalived/keepalived.conf'.
Mar 6 21:10:35 box02 Keepalived_healthcheckers[27514]: Opening file '/etc/keepalived/keepalived.conf'.
Mar 6 21:10:35 box02 Keepalived_vrrp[27515]: Truncating auth_pass to 8 characters
Mar 6 21:10:35 box02 Keepalived_vrrp[27515]: VRRP_Instance(VI_1) removing protocol VIPs.
Mar 6 21:10:35 box02 Keepalived_vrrp[27515]: Using LinkWatch kernel netlink reflector...
Mar 6 21:10:35 box02 Keepalived_vrrp[27515]: VRRP_Instance(VI_1) Entering BACKUP STATE
Mar 6 21:10:35 box02 Keepalived_vrrp[27515]: VRRP sockpool: [ifindex(3), proto(112), unicast(0), fd(10,11)]
Mar 6 21:10:35 box02 Keepalived_vrrp[27515]: Remote SMTP server [177.185.201.253]:25 connected.
Mar 6 21:10:36 box02 Keepalived_vrrp[27515]: VRRP_Instance(VI_1) Now in FAULT state
Mar 6 21:10:36 box02 Keepalived_vrrp[27515]: VRRP_Script(chk_myscript) succeeded
Mar 6 21:10:37 box02 Keepalived_vrrp[27515]: VRRP_Instance(VI_1) Entering BACKUP STATE
Mar 6 21:10:37 box02 Keepalived_vrrp[27515]: Remote SMTP server [177.185.201.253]:25 connected.

If you need to force the failover to test transitions manually, edit the keepalived.conf and consider that, the host configured with the lowest priority will be the MASTER. One more hint is that this is all running in 5 Vagrant VMs so when you have private IPs and a virtualbox__intnet, it’s going form an internal network, and you have a range of IPs available to you. As we did here, pick up one to be the VIP and move forward.

About Transitions:

One thing to note accessing the syslog (/var/log/messages in our case) is that you can see the negotiation about who is the MASTER and who is the BACKUP. Starting up the keepalived on both boxes, you can see this below sequence:

Mar 29 17:48:29 box01 Keepalived[8569]: Starting Healthcheck child process, pid=8570
Mar 29 17:48:29 box01 Keepalived[8569]: Starting VRRP child process, pid=8571
Mar 29 17:48:29 box01 systemd: Started LVS and VRRP High Availability Monitor.
Mar 29 17:48:29 box01 Keepalived_healthcheckers[8570]: Opening file '/etc/keepalived/keepalived.conf'.
Mar 29 17:48:29 box01 Keepalived_vrrp[8571]: Registering Kernel netlink reflector
Mar 29 17:48:29 box01 Keepalived_vrrp[8571]: Registering Kernel netlink command channel
Mar 29 17:48:29 box01 Keepalived_vrrp[8571]: Registering gratuitous ARP shared channel
Mar 29 17:48:29 box01 Keepalived_vrrp[8571]: Opening file '/etc/keepalived/keepalived.conf'.
Mar 29 17:48:29 box01 Keepalived_vrrp[8571]: VRRP_Instance(VI_1) removing protocol VIPs.
Mar 29 17:48:29 box01 Keepalived_vrrp[8571]: Using LinkWatch kernel netlink reflector...
Mar 29 17:48:29 box01 Keepalived_vrrp[8571]: VRRP sockpool: [ifindex(3), proto(112), unicast(0), fd(10,11)]
Mar 29 17:48:29 box01 Keepalived_vrrp[8571]: VRRP_Instance(VI_1) Transition to MASTER STATE
Mar 29 17:48:30 box01 Keepalived_vrrp[8571]: VRRP_Instance(VI_1) Entering FAULT STATE
Mar 29 17:48:30 box01 Keepalived_vrrp[8571]: VRRP_Instance(VI_1) Now in FAULT state
Mar 29 17:48:35 box01 Keepalived_vrrp[8571]: VRRP_Script(chk_myscript) succeeded
Mar 29 17:48:36 box01 Keepalived_vrrp[8571]: VRRP_Instance(VI_1) Entering BACKUP STATE
Mar 29 17:48:37 box01 Keepalived_vrrp[8571]: VRRP_Instance(VI_1) forcing a new MASTER election
Mar 29 17:48:38 box01 Keepalived_vrrp[8571]: VRRP_Instance(VI_1) Transition to MASTER STATE
Mar 29 17:48:39 box01 Keepalived_vrrp[8571]: VRRP_Instance(VI_1) Entering MASTER STATE
Mar 29 17:48:39 box01 Keepalived_vrrp[8571]: VRRP_Instance(VI_1) setting protocol VIPs.
Mar 29 17:48:39 box01 Keepalived_vrrp[8571]: Sending gratuitous ARP on eth1 for 10.0.0.100
Mar 29 17:48:39 box01 Keepalived_vrrp[8571]: VRRP_Instance(VI_1) Sending/queueing gratuitous ARPs on eth1 for 10.0.0.100
Mar 29 17:48:39 box01 Keepalived_vrrp[8571]: Sending gratuitous ARP on eth1 for 10.0.0.100
Mar 29 17:48:44 box01 Keepalived_vrrp[8571]: Sending gratuitous ARP on eth1 for 10.0.0.100
Mar 29 17:48:44 box01 Keepalived_vrrp[8571]: VRRP_Instance(VI_1) Sending/queueing gratuitous ARPs on eth1 for 10.0.0.100
Mar 29 17:48:44 box01 Keepalived_vrrp[8571]: Sending gratuitous ARP on eth1 for 10.0.0.100

From the above, you can clearly see who is the current MASTER. But, how is it on the BACKUP side?

Mar 29 17:52:49 box02 Keepalived[5524]: Starting Healthcheck child process, pid=5525
Mar 29 17:52:49 box02 Keepalived[5524]: Starting VRRP child process, pid=5526
Mar 29 17:52:49 box02 systemd: Started LVS and VRRP High Availability Monitor.
Mar 29 17:52:49 box02 Keepalived_healthcheckers[5525]: Opening file '/etc/keepalived/keepalived.conf'.
Mar 29 17:52:49 box02 Keepalived_vrrp[5526]: Registering Kernel netlink reflector
Mar 29 17:52:49 box02 Keepalived_vrrp[5526]: Registering Kernel netlink command channel
Mar 29 17:52:49 box02 Keepalived_vrrp[5526]: Registering gratuitous ARP shared channel
Mar 29 17:52:49 box02 Keepalived_vrrp[5526]: Opening file '/etc/keepalived/keepalived.conf'.
Mar 29 17:52:49 box02 Keepalived_vrrp[5526]: VRRP_Instance(VI_1) removing protocol VIPs.
Mar 29 17:52:49 box02 Keepalived_vrrp[5526]: Using LinkWatch kernel netlink reflector...
Mar 29 17:52:49 box02 Keepalived_vrrp[5526]: VRRP sockpool: [ifindex(3), proto(112), unicast(0), fd(10,11)]
Mar 29 17:52:49 box02 Keepalived_vrrp[5526]: VRRP_Script(chk_myscript) succeeded
Mar 29 17:52:49 box02 Keepalived_vrrp[5526]: VRRP_Instance(VI_1) Transition to MASTER STATE
Mar 29 17:52:49 box02 Keepalived_vrrp[5526]: VRRP_Instance(VI_1) Received advert with higher priority 101, ours 100
Mar 29 17:52:49 box02 Keepalived_vrrp[5526]: VRRP_Instance(VI_1) Entering BACKUP STATE

You see the priority comparison between the two hosts and win the one having the highest vrrp_scrip.priority.

In the end, what you see is the VIP added to the vrrp_scrip.interface on the MASTER:

[root@box01 ~]# ip addr show eth1
3: eth1: &lt;BROADCAST,MULTICAST,UP,LOWER_UP&gt; mtu 1500 qdisc pfifo_fast state UP group default qlen 1000
    link/ether 08:00:27:09:15:27 brd ff:ff:ff:ff:ff:ff
    inet 10.0.0.11/24 brd 10.0.0.255 scope global noprefixroute eth1
       valid_lft forever preferred_lft forever
    inet 10.0.0.100/24 scope global secondary eth1
       valid_lft forever preferred_lft forever
    inet6 fe80::a00:27ff:fe09:1527/64 scope li

MaxScale Passive Mode

When running the MaxScale HA with keepalived and dealing with Replication Clusters, we need to protect the environment against operational mistakes that could happen as both sides the MASTER and the BACKUP MaxScales will have MaxScale instances up and running and accepting connections, despite of just one side being active at-a-time as the VIP in one side only (unless you resolve to do bad things and point the so-called small apps to the passive MaxScale endpoint directly – this is bad!!). To protect the environment, MaxScale can be set in Passive mode and in that mode, the switchover/failover/automatic rejoin won’t be triggered. These operations will be triggered only on the active MaxScale.

#!/bin/bash
 
TYPE=$1
NAME=$2
STATE=$3
 
OUTFILE=/tmp/maxify.log
 
case $STATE in
  "MASTER") echo "Setting this MaxScale node to active mode" &gt; $OUTFILE
                  maxctrl alter maxscale passive false
                  exit 0
                  ;;
  "BACKUP") echo "Setting this MaxScale node to passive mode" &gt; $OUTFILE
                  maxctrl alter maxscale passive true
                  exit 0
                  ;;
  "FAULT")  echo "MaxScale failed the status check." &gt; $OUTFILE
                  maxctrl alter maxscale passive true
                  exit 0
                  ;;
        *)        echo "Unknown state" &gt; $OUTFILE
                  exit 1
                  ;;
esac

Adjust then the script permissions and ownership:

#: the maxify need to be like the below
chmod u+x /usr/local/mariadb_rdba/maxify.sh
chown keepalived_script:root /usr/local/mariadb_rdba/maxify.sh

Additional notes:

On some setups and implementations, I’ve seen the signal 15 being sent to the keepalived process what can make a transition to happen. Looking to see if other users have the same issue, I found this post on GitHub. The recommendation was to add a local DNS resolution and increase the vrrp_scrip.interval from the current value to something else bigger so the problem can be solved. The events appearing on syslog is like the ones below:

Mar  7 20:36:06 box01 Keepalived_vrrp[29211]: VRRP_Script(chk_myscript) timed out
Mar  7 20:36:06 box01 Keepalived_vrrp[29211]: VRRP_Instance(VI_1) Entering FAULT STATE
Mar  7 20:36:06 box01 Keepalived_vrrp[29211]: VRRP_Instance(VI_1) removing protocol VIPs.
Mar  7 20:36:06 box01 Keepalived_vrrp[29211]: VRRP_Instance(VI_1) Now in FAULT state
Mar  7 20:36:06 box01 Keepalived_vrrp[29211]: /usr/local/mariadb_rdba/maxping.sh exited due to signal 15
Mar  7 20:36:08 box01 Keepalived_vrrp[29211]: /usr/local/mariadb_rdba/maxping.sh exited due to signal 15
Mar  7 20:36:12 box01 Keepalived_vrrp[29211]: /usr/local/mariadb_rdba/maxping.sh exited due to signal 15
Mar  7 20:36:14 box01 Keepalived_vrrp[29211]: /usr/local/mariadb_rdba/maxping.sh exited due to signal 15
Mar  7 20:36:16 box01 Keepalived_vrrp[29211]: /usr/local/mariadb_rdba/maxping.sh exited due to signal 15
Mar  7 20:36:18 box01 Keepalived_vrrp[29211]: /usr/local/mariadb_rdba/maxping.sh exited due to signal 15
Mar  7 20:36:20 box01 Keepalived_vrrp[29211]: /usr/local/mariadb_rdba/maxping.sh exited due to signal 15
Mar  7 20:36:22 box01 Keepalived_vrrp[29211]: /usr/local/mariadb_rdba/maxping.sh exited due to signal 15
Mar  7 20:36:24 box01 Keepalived_vrrp[29211]: /usr/local/mariadb_rdba/maxping.sh exited due to signal 15
Mar  7 20:36:28 box01 Keepalived_vrrp[29211]: /usr/local/mariadb_rdba/maxping.sh exited due to signal 15
Mar  7 20:36:30 box01 Keepalived_vrrp[29211]: /usr/local/mariadb_rdba/maxping.sh exited due to signal 15
Mar  7 20:36:33 box01 Keepalived_vrrp[29211]: VRRP_Script(chk_myscript) succeeded
Mar  7 20:36:35 box01 Keepalived_vrrp[29211]: Kernel is reporting: interface eth1 UP
Mar  7 20:36:35 box01 Keepalived_vrrp[29211]: VRRP_Instance(VI_1): Transition to MASTER STATE
Mar  7 20:36:35 box01 Keepalived_vrrp[29211]: VRRP_Instance(VI_1) Transition to MASTER STATE
Mar  7 20:36:36 box01 Keepalived_vrrp[29211]: VRRP_Instance(VI_1) Entering MASTER STATE
Mar  7 20:36:36 box01 Keepalived_vrrp[29211]: VRRP_Instance(VI_1) setting protocol VIPs.
Mar  7 20:36:36 box01 Keepalived_vrrp[29211]: Sending gratuitous ARP on eth1 for 10.0.0.100

When debugging the above signal 15, it can interchange for signal 3 also, and considering my experience, it can be a mixture of very low timeout command within the maxping.sh and the vrrp_scrip.interval. For small boxes or even, networks with high latency, I recommend you to have greater values. It can start flapping and the IP will be moving around many times. Here you need to search a good balance. It’s good to mention that high values for the vrrp_scrip.interval will give you more time for the VRRP to realize it’s in the FAULT state and that the transition should be triggered.

Another issue you can face is when SELinux is being enforced and the below messages will appear on syslog:

Apr  4 20:49:27 uat-maxsq01 Keepalived_vrrp[7517]: Couldn't setuid: 1000 (Operation not permitted)
Apr  4 20:49:29 uat-maxsq01 Keepalived_vrrp[7519]: Couldn't setuid: 1000 (Operation not permitted)
Apr  4 20:49:31 uat-maxsq01 Keepalived_vrrp[7522]: Couldn't setuid: 1000 (Operation not permitted)
Apr  4 20:49:33 uat-maxsq01 Keepalived_vrrp[7528]: Couldn't setuid: 1000 (Operation not permitted)
Apr  4 20:49:35 uat-maxsq01 Keepalived_vrrp[7577]: Couldn't setuid: 1000 (Operation not permitted)
Apr  4 20:49:37 uat-maxsq01 Keepalived_vrrp[7580]: Couldn't setuid: 1000 (Operation not permitted)

You just need to setenforce 0 to make it able to do what it needs to do.

[root@uat-maxsq01 ~]# setenforce 0
[root@uat-maxsq01 ~]#

And then you can see the action being completed yet tailing the syslog:

Apr  4 20:50:01 uat-maxsq01 systemd: Created slice User Slice of root.
Apr  4 20:50:01 uat-maxsq01 systemd: Started Session 1415 of user root.
Apr  4 20:50:01 uat-maxsq01 systemd: Removed slice User Slice of root.

It’s clear that something else happened that made the maxping.sh script execution to fail, starting a transition on the current MASTER.

AddThis Social Bookmark Button

MariaDB Maxscale 2.1 and SSL Certificates

dezembro 18th, 2017 | by: Bianchi | Posted in: Data Infrastructure, MariaDB Maxscale | No Comments »

MariaDB Maxscale has become more and more popular since some time ago, and it is mostly adopted by users that would like to take advantage of a good strategy for scaling out databases and the data infrastructure. With this, of course, come together with the concerns in how to make the environment safe, adopting the best industry’s practices. Most of the MariaDB Maxscale adopters have or will have Maxscale handling traffic to database instances/backends in a wan, where servers can be added to the MariaDB’s Intelligent Database Proxy and based on the configurations, traffic is routed to those servers. We know very well that the man-in-the-middle and some other strategies to intercept information can be used while data is being replicated, while connections are routed to the backend databases.

This blog post will explore the setup of an environment using self-signed OpenSSL certificates to make it safe enough to replicate data between the multiple backend database servers and mainly, we’re going to show you how you can setup the communication between the MariaDB Maxscale and the backend.

The following are the servers and version we’re using on this blog:

  • 4 VMs vagrant-wise created:
    • 1 MariaDB Maxscale;
    • 1 MariaDB Server as Master;
    • 2 MariaDB Server as Replica;
  • CentOS 7.3 as the operating system;
  • MariaDB Server 10.2.10;
  • MariaDB Maxscale 2.1.10;

For this blog, I assume you already have the servers configured and replicating (one master and two replicas).

MariaDB Maxscale will look like this below at the end of this blog:

[root@maxscale ~]# maxadmin list servers
Servers.
-------------------+-----------------+-------+-------------+--------------------
Server             | Address         | Port  | Connections | Status
-------------------+-----------------+-------+-------------+--------------------
prod_mariadb01     | 192.168.50.11   |  3306 |           0 | Master, Running
prod_mariadb02     | 192.168.50.12   |  3306 |           0 | Slave, Running
prod_mariadb03     | 192.168.50.13   |  3306 |           0 | Slave, Running
-------------------+-----------------+-------+-------------+--------------------

If you’re following this tutorial, make sure you setup on servers the MariaDB Official repository to have access to the software we will need to set up as we go through.

#: setup MariaDB Official repository
[root@box01 ~]# curl -sS https://downloads.mariadb.com/MariaDB/mariadb_repo_setup | sudo bash
[info] Repository file successfully written to /etc/yum.repos.d/mariadb.repo.
[info] Adding trusted package signing keys...
[info] Succeessfully added trusted package signing keys.

Generating the Self-Signed Certificates

The place to start with this is to generate your self-signed OpenSSL certificates, but, if you would like to acquire a certificate for any of the existing entities that will sign the certificate for you, that’s fine as well. Here, I’m going through the creation of certificates with OpenSSL, present on most of the Linux Distributions by the default and then, I’m going to use that. Below you can find the command to generate your certificates, the same as I used to generate the certificates at /etc/my.cnf.d/certs/. One detail here is that you won’t see this directory on the MariaDB Maxscale host, so, you will need to create that directory and move certs there.

[root@maxscale ~]# mkdir -pv /etc/my.cnf.d/certs/
mkdir: created directory ‘/etc/my.cnf.d/certs/’

[root@box01 ~]# mkdir -pv /etc/my.cnf.d/certs/
mkdir: created directory ‘/etc/my.cnf.d/certs/’

[root@box02 ~]# mkdir -pv /etc/my.cnf.d/certs/
mkdir: created directory ‘/etc/my.cnf.d/certs/’

[root@box03 ~]# mkdir -pv /etc/my.cnf.d/certs/
mkdir: created directory ‘/etc/my.cnf.d/certs/’

I created the directory on the MariaDB Maxscale server host, moved my prompt to /etc/my.cnf.d/certs/ and then, created the certificates using the below commands.

#: generate the ca-key
$ openssl genrsa 2048 > ca-key.pem

#: server certs
$ openssl req -new -x509 -nodes -days 9999 -key ca-key.pem > ca-cert.pem
$ openssl req -newkey rsa:2048 -days 1000 -nodes -keyout server-key.pem > server-req.pem
$ openssl x509 -req -in server-req.pem -days 3600 -CA ca-cert.pem -CAkey ca-key.pem -set_serial 01 -out server-cert.pem

#: client certs
$ openssl req -newkey rsa:2048 -days 3600 -nodes -keyout client-key.pem -out client-req.pem
$ openssl rsa -in client-key.pem -out client-key.pem
$ openssl x509 -req -in client-req.pem -days 3600 -CA ca-cert.pem -CAkey ca-key.pem -set_serial 01 -out client-cert.pem

#: verify generated certificates
$ openssl verify -CAfile ca-cert.pem server-cert.pem client-cert.pem
server-cert.pem: OK
client-cert.pem: OK

One thing you should be aware of if the last part doesn’t go well and the certificates verifications don’t give you an OK is that you need to have different names for the CN or Common Names. The error that appeared sometimes is like the one below:

#: execution the SSL certificates verification
$ openssl verify -CAfile ca-cert.pem server-cert.pem client-cert.pem
server-cert.pem: C = BR, ST = MG, L = BH, O = WBC, OU = WB, CN = WB, emailAddress = me@all.com
error 18 at 0 depth lookup:self signed certificate
OK
client-cert.pem: C = BR, ST = MG, L = BH, O = WBC, OU = WB, CN = WB, emailAddress = me@all.com
error 18 at 0 depth lookup:self signed certificate
OK

After finishing the certificate’s creation successfully and then, pass through the verification, as shown above, you will have the following files at /etc/my.cnf.d/certs/:

#: listing servers on MariaDB Maxscale server host
[root@maxscale ~]# ls -lh /etc/my.cnf.d/certs/
total 32K
-rw-r--r-- 1 root root 1.4K Nov  5 11:08 ca-cert.pem
-rw-r--r-- 1 root root 1.7K Nov  5 11:07 ca-key.pem
-rw-r--r-- 1 root root 1.3K Nov  5 11:11 client-cert.pem
-rw-r--r-- 1 root root 1.7K Nov  5 11:11 client-key.pem
-rw-r--r-- 1 root root 1.1K Nov  5 11:10 client-req.pem
-rw-r--r-- 1 root root 1.3K Nov  5 11:09 server-cert.pem
-rw-r--r-- 1 root root 1.7K Nov  5 11:09 server-key.pem
-rw-r--r-- 1 root root 1.1K Nov  5 11:09 server-req.pem

Now you do have the client’s and server’s certificates you need to go ahead with this setup.

Setting Up GTID Replication SSL Based

If you got new servers, maybe it’s just easy enough to say that, to configure replication SSL based, you need to have a user for each of the slaves/replicas you plan to have under your master server or as well, you can have a specialized user create for connecting to your master from an IP using a wildcard, such as 192.168.100.%. I will encourage you to have one user per slave/replica as it can enforce the security of your environment and avoid other issues like someone else on the same network trying to gain access on the master database. It’s OK that the replication user just has REPLICATION SLAVE and REPLICATION CLIENT privileges, but, you never know what is gonna be attempted. By the way, following what should be done, you have the following:

  1. Move client certificates to all 3 servers, adding certificates at /etc/my.cnf.d/certs/ (you need to create this directory on all four servers);
  2. Add a file under the /etc/my.cnf.d names ssl.cnf as MariaDB will read that when it starts up mysqld;
  3. Create the users, one for each of the slaves, on master with the directive REQUIRE SSL;
  4. Configure replication on slaves/replicas with that user and using the required MASTER_SSL directives on the CHANGE MASTER TO command.

To move files around, I like to have a key based authentication configured to makes things easier as you don’t need to digit passwords anymore after getting keys in place on all the servers. You can generate you a key on each of the servers, copy them all them all to the ~/.ssh/authorized_keys file on the central servers, which in my case is the MariaDB Maxscale server host and them, send the files to all the servers. One additional thing you need to pay attention, in this case, is that the authorized_keys file should have permission set as 0600 to make it work. So, this is a way to go, or, you can use your user’s password as well, it’s gonna work. You can as well for sure streamline the process like below (it’s a very bad behavior generate a key without a passphrase, so, consider a passphrase to your keys to make it safer):

#: generate a simple key, you can have a strong one
#: if you go create it on production
[root@maxscale ~]# ssh-keygen
Generating public/private rsa key pair.
Enter file in which to save the key (/root/.ssh/id_rsa):
Enter passphrase (empty for no passphrase):
Enter same passphrase again:
Your identification has been saved in /root/.ssh/id_rsa.
Your public key has been saved in /root/.ssh/id_rsa.pub.
[...snip...]

Let’s get key published on database servers:

#: adding the public key on the other hosts
[root@maxscale ~]# for i in {11..13}; do ssh-copy-id -i ~/.ssh/id_rsa.pub 192.168.50.$i; done
/bin/ssh-copy-id: INFO: attempting to log in with the new key(s), to filter out any that are already installed
/bin/ssh-copy-id: INFO: 1 key(s) remain to be installed -- if you are prompted now it is to install the new keys
root@192.168.50.11's password:
Number of key(s) added: 1
Now try logging into the machine, with: "ssh '192.168.50.11'"
and check to make sure that only the key(s) you wanted were added.

/bin/ssh-copy-id: INFO: attempting to log in with the new key(s), to filter out any that are already installed
/bin/ssh-copy-id: INFO: 1 key(s) remain to be installed -- if you are prompted now it is to install the new keys
root@192.168.50.12's password:
Number of key(s) added: 1
Now try logging into the machine, with: "ssh '192.168.50.12'"
and check to make sure that only the key(s) you wanted were added.

/bin/ssh-copy-id: INFO: attempting to log in with the new key(s), to filter out any that are already installed
/bin/ssh-copy-id: INFO: 1 key(s) remain to be installed -- if you are prompted now it is to install the new keys
root@192.168.50.13's password:
Number of key(s) added: 1
Now try logging into the machine, with: "ssh '192.168.50.13'"
and check to make sure that only the key(s) you wanted were added.

#: testing if key based SSH is all set
[root@maxscale ~]# for i in {11..13}; do ssh 192.168.50.$i hostname; done
box01
box02
box03

Once SSH keys are in place, we can just move the certificates from your central host to the others; I use rsync for the below task and as a hint, you will need to have it on all servers:

#: moving certificates for database hosts
[root@maxscale ~]# for i in {11..13}; do rsync -avrP -e ssh /etc/my.cnf.d/certs/* 192.168.50.$i:/etc/my.cnf.d/certs/; done
sending incremental file list
ca-cert.pem
  1261 100% 0.00kB/s 0:00:00 (xfer#1, to-check=7/8)
ca-key.pem
  1675 100% 1.60MB/s 0:00:00 (xfer#2, to-check=6/8)
client-cert.pem
  1135 100% 1.08MB/s 0:00:00 (xfer#3, to-check=5/8)
client-key.pem
  1675 100% 1.60MB/s 0:00:00 (xfer#4, to-check=4/8)
client-req.pem
  976 100% 953.12kB/s 0:00:00 (xfer#5, to-check=3/8)
server-cert.pem
  1135 100% 1.08MB/s 0:00:00 (xfer#6, to-check=2/8)
server-key.pem
  1704 100% 1.63MB/s 0:00:00 (xfer#7, to-check=1/8)
server-req.pem
  976 100% 953.12kB/s 0:00:00 (xfer#8, to-check=0/8)
 
sent 11046 bytes received 164 bytes 22420.00 bytes/sec
total size is 10537 speedup is 0.94
[...snip...]

Once certificates are located on all servers, next step is to add the ssl.cnf at /etc/my.cnf.d, as below:

#: add the below as a content of the file /etc/my.cnf.d/ssl.cnf
[root@box01 ~]# cat /etc/my.cnf.d/ssl.cnf
[client]
ssl
ssl-ca=/etc/my.cnf.d/certs/ca-cert.pem
ssl-cert=/etc/my.cnf.d/certs/client-cert.pem
ssl-key=/etc/my.cnf.d/certs/client-key.pem
[mysqld]
ssl
ssl-ca=/etc/my.cnf.d/certs/ca-cert.pem
ssl-cert=/etc/my.cnf.d/certs/server-cert.pem
ssl-key=/etc/my.cnf.d/certs/server-key.pem

You should restart your MariaDB Server after adding the certificates configuration, as if you don’t, it’s not going to be possible to connect to the database server with the users we created. In case something goes wrong with certificates, and you need to generate new ones, repeating the process aforementioned, you’ll need to restart database servers as client certificates are loaded to the memory, and you can get an error like below if you have a certificates mismatch:

[root@box01 certs]# mysql
ERROR 2026 (HY000): SSL connection error: error:14090086:SSL routines:SSL3_GET_SERVER_CERTIFICATE:certificate verify failed

Let’s now create a specific replication user for each of the servers we have on our replication topology currently:

box01 [(none)]> CREATE USER repl_ssl@'192.168.50.11' IDENTIFIED BY '123456';
Query OK, 0 rows affected (0.00 sec)

box01 [(none)]> GRANT REPLICATION SLAVE, REPLICATION CLIENT ON *.* TO repl_ssl@'192.168.50.11' REQUIRE SSL;
Query OK, 0 rows affected (0.00 sec)

box01 [(none)]> CREATE USER repl_ssl@'192.168.50.12' IDENTIFIED BY '123456';
Query OK, 0 rows affected (0.00 sec)

box01 [(none)]> GRANT REPLICATION SLAVE, REPLICATION CLIENT ON *.* TO repl_ssl@'192.168.50.12' REQUIRE SSL;
Query OK, 0 rows affected (0.00 sec)

box01 [(none)]> CREATE USER repl_ssl@'192.168.50.13' IDENTIFIED BY '123456';
Query OK, 0 rows affected (0.00 sec)

box01 [(none)]> GRANT REPLICATION SLAVE, REPLICATION CLIENT ON *.* TO repl_ssl@'192.168.50.13' REQUIRE SSL;
Query OK, 0 rows affected (0.00 sec)

Above, we created one user per server, and I did that thinking at the moment that we eventually need to switch over the current master to one of the slaves, so, that way, the replication user don’t need to be of concern when dealing with an emergency or even when a planned failover is required. The next step should be thought in your case, and I’m going to simplify the case here and assume we’re working with a new environment, not in production yet. For changing your production environment to use SSL certificates, you need to spend more time on this, planning it well to avoid services disruptions. So, I’m going to grab the replication coordinates on the master, out of SHOW MASTER STATUS and then, issue the command CHANGE MASTER TO on slaves to get replication going. Here, I assumed you moved all the certs to all database servers, and they are living at /etc/my.cnf.d/certs/.

#: getting the current master status
box01 [(none)]> show master status\G
*************************** 1. row ***************************
            File: box01-bin.000024
        Position: 877
    Binlog_Do_DB:
Binlog_Ignore_DB:
1 row in set (0.00 sec)

#: the CHANGE MASTER TO command should be something like the below
box02 [(none)]> CHANGE MASTER TO MASTER_HOST='192.168.50.11',
  -> MASTER_USER='repl_ssl',
  -> MASTER_PASSWORD='123456',
  -> MASTER_LOG_FILE='box01-bin.000024',
  -> MASTER_LOG_POS=877,
  -> MASTER_SSL=1,
  -> MASTER_SSL_CA='/etc/my.cnf.d/certs/ca-cert.pem',
  -> MASTER_SSL_CERT='/etc/my.cnf.d/certs/client-cert.pem',
  -> MASTER_SSL_KEY='/etc/my.cnf.d/certs/client-key.pem';
Query OK, 0 rows affected (0.05 sec)

box02 [(none)]> start slave;
Query OK, 0 rows affected (0.00 sec)

box02 [(none)]> show slave status\G
*************************** 1. row ***************************
  Slave_IO_State: Waiting for master to send event
  Master_Host: 192.168.50.11
  Master_User: repl_ssl
  Master_Port: 3306
  Connect_Retry: 3
  Master_Log_File: box01-bin.000028
  Read_Master_Log_Pos: 794
  Relay_Log_File: box02-relay-bin.000006
  Relay_Log_Pos: 1082
  Relay_Master_Log_File: box01-bin.000028
  Slave_IO_Running: Yes
  Slave_SQL_Running: Yes
  [...snip...]
  Master_SSL_Allowed: Yes
  Master_SSL_CA_File: /etc/my.cnf.d/certs/ca-cert.pem
  Master_SSL_CA_Path:
  Master_SSL_Cert: /etc/my.cnf.d/certs/client-cert.pem
  Master_SSL_Cipher:
  Master_SSL_Key: /etc/my.cnf.d/certs/client-key.pem
  Seconds_Behind_Master: 0
  Last_IO_Errno: 0
  Last_IO_Error:
  Last_SQL_Errno: 0
  Last_SQL_Error:
  Replicate_Ignore_Server_Ids:
  Master_Server_Id: 1
  Master_SSL_Crl: /etc/my.cnf.d/certs/ca-cert.pem
  Master_SSL_Crlpath:
  Using_Gtid: No
  Gtid_IO_Pos:
  Replicate_Do_Domain_Ids:
  Replicate_Ignore_Domain_Ids:
  Parallel_Mode: conservative
1 row in set (0.00 sec)

You can use GTIDs as well, and then, you CHANGE MASTER TO command will be something like:

box03 [(none)]> CHANGE MASTER TO MASTER_HOST='192.168.50.11',
  -> MASTER_USER='repl_ssl',
  -> MASTER_PASSWORD='123456',
  -> MASTER_USE_GTID=SLAVE_POS,
  -> MASTER_SSL=1,
  -> MASTER_SSL_CA='/etc/my.cnf.d/certs/ca-cert.pem',
  -> MASTER_SSL_CERT='/etc/my.cnf.d/certs/client-cert.pem',
  -> MASTER_SSL_KEY='/etc/my.cnf.d/certs/client-key.pem';
Query OK, 0 rows affected (0.05 sec)

box03 [(none)]> start slave;
Query OK, 0 rows affected (0.04 sec)

box03 [(none)]> show slave status\G
*************************** 1. row ***************************
  Slave_IO_State: Waiting for master to send event
  Master_Host: 192.168.50.11
  Master_User: repl_ssl
  Master_Port: 3306
  Connect_Retry: 3
  Master_Log_File: box01-bin.000028
  Read_Master_Log_Pos: 794
  Relay_Log_File: box03-relay-bin.000002
  Relay_Log_Pos: 654
  Relay_Master_Log_File: box01-bin.000028
  Slave_IO_Running: Yes
  Slave_SQL_Running: Yes
  [...snip...]
  Master_SSL_Allowed: Yes
  Master_SSL_CA_File: /etc/my.cnf.d/certs/ca-cert.pem
  Master_SSL_CA_Path:
  Master_SSL_Cert: /etc/my.cnf.d/certs/client-cert.pem
  Master_SSL_Cipher:
  Master_SSL_Key: /etc/my.cnf.d/certs/client-key.pem
  Seconds_Behind_Master: 0
  Last_IO_Errno: 0
  Last_IO_Error:
  Last_SQL_Errno: 0
  Last_SQL_Error:
  Replicate_Ignore_Server_Ids:
  Master_Server_Id: 1
  Master_SSL_Crl: /etc/my.cnf.d/certs/ca-cert.pem
  Master_SSL_Crlpath:
  Using_Gtid: Slave_Pos
  Gtid_IO_Pos: 0-1-911075
  Replicate_Do_Domain_Ids:
  Replicate_Ignore_Domain_Ids:
  Parallel_Mode: conservative
1 row in set (0.00 sec)

One of the things you can check at the end to make sure replication is all set is of course if error log gives you a clear view of everything that was set up until now and if you added the variable report_host, you could see the result of SHOW SLAVE HOSTS on the master like below:

box01 [(none)]> show slave hosts\G 
*************************** 1. row ***************************
Server_id: 3
  Host: box03.wb.com
  Port: 3306
Master_id: 1

*************************** 2. row ***************************
Server_id: 2
  Host: box02.wb.com
  Port: 3306
Master_id: 1
2 rows in set (0.00 sec)

Unfortunately, the @@report_host is not a dynamic system variable, and you need to add it to the MariaDB Server configuration file and restart mysqld to make it assume the new value.  It’s passed to the master when the slave/replica’s IO_THREAD establish the connection with the master (handshake process).   Setting Up MariaDB Maxscale and the ReadWriteSplit SSL Based   Until here, we went through the details of each of the configurations from the certificates generation, replication configuration, and setup. Now, we need to go over the Maxscale installation; the commands required to dynamically create the monitor, a service, a listener and add servers to have at the end the configurations for the ReadWriteSplit router to handle reads and writes for the master and slaves.

The steps here will be:

  1. Setup MariaDB Maxscale;
  2. Put together a basic configuration for MariaDB Maxscale and start it;
  3. Create a user for the Maxscale’s Service and another one for the Monitor on backends with the REQUIRE SSL;
  4. Add SSL certificates to the server’s and listener definitions files;
  5. Run commands that will create a monitor, a listener, a service; we will then create the servers and add them to the monitor;
  6. Create a user for the application on backends.

To setup MariaDB Maxscale (when writing this blog, it was at its 2.1.10 version), run the below knowing that the MariaDB Official repository was set up at the very beginning of this exercise:

#: setting up MariaDB Maxscale
[root@maxscale ~]# yum install maxscale -y

Loaded plugins: fastestmirror

Loading mirror speeds from cached hostfile
 * base: mirror.nbtelecom.com.br
 * epel: mirror.cedia.org.ec
 * extras: mirror.nbtelecom.com.br
 * updates: mirror.nbtelecom.com.br

Resolving Dependencies
--> Running transaction check
---> Package maxscale.x86_64 0:2.1.10-1 will be updated
---> Package maxscale.x86_64 0:2.1.11-1 will be an update
--> Finished Dependency Resolution
[...snip...]

[root@maxscale maxscale.cnf.d]# maxscale --version
MaxScale 2.1.11

You will notice that the password for the maxuser_ssl and maxmon_ssl users is a kind of hash. It was generated using maxkeys to avoid clean text, as you can see below. You will be required to configure yours instead of using the below one.

#: create the secrets file, by default at /var/lib/maxscale 
[root@maxscale ~]# maxkeys
Generating .secrets file in /var/lib/maxscale.

#: the password configured on database servers, but encrypted for maxscale configs
[root@maxscale ~]# maxpasswd /var/lib/maxscale/ 123456
AF76BE841B5B4692D820A49298C00272

#: change the file /var/lib/maxscale/.secrets ownership
[root@maxscale ~]# chown maxscale:maxscale /var/lib/maxscale/.secrets

Let’s now put together a basic configuration to start MariaDB Maxscale. Add the below configurations to the maxscale’s configuration file so you can start maxscale:

[root@maxscale ~]# cat /etc/maxscale.cnf
[maxscale]
threads=auto
log_info=true

[rwsplit-service]
type=service
router=readwritesplit
user=maxuser_ssl
passwd=AF76BE841B5B4692D820A49298C00272

[CLI]
type=service
router=cli

[CLI Listener]
type=listener
service=CLI
protocol=maxscaled
socket=default

Before starting MariaDB Maxscale, adding a listener to the pre-defined service, a monitor and creating and adding our servers on which we set up the replication previously, we need to create users, for the service, the monitor and for the application that will connect to the backend servers through Maxscale. Below users should be created on master and then, replicate for the replicas:

#: maxscale's mysqlmon user
sudo mysql -e "grant all on *.* to maxmon_ssl@'192.168.50.100' identified by '123456' require ssl" -vvv

#: maxscale's service user
sudo mysql -e "grant all on *.* to maxuser_ssl@'192.168.50.100' identified by '123456' require ssl" -vvv

#: application user
sudo mysql -e "grant select,insert,delete,update on *.* to appuser_ssl@'192.168.%' identified by '123456' require ssl;" -vvv

Now we can start MariaDB Maxscale using the basic configuration file we just created, I created mine at /root/maxscale_configs. So, I can start Maxscale doing like below and checking the log file at /var/log/maxscale/maxscale.log:

[root@maxscale maxscale.cnf.d]# [root@maxscale certs]# systemctl start maxscale
[root@maxscale certs]# systemctl status maxscale
● maxscale.service - MariaDB MaxScale Database Proxy
   Loaded: loaded (/usr/lib/systemd/system/maxscale.service; disabled; vendor preset: disabled)
   Active: active (running) since Fri 2017-12-15 13:21:57 GMT; 5s ago
  Process: 13138 ExecStart=/usr/bin/maxscale (code=exited, status=0/SUCCESS)
  Process: 13135 ExecStartPre=/usr/bin/install -d /var/run/maxscale -o maxscale -g maxscale (code=exited, status=0/SUCCESS)
 Main PID: 13140 (maxscale)
   CGroup: /system.slice/maxscale.service
           └─13140 /usr/bin/maxscale

Dec 15 13:21:57 maxscale maxscale[13140]: Loaded module readwritesplit: V1.1.0 from /usr/lib64/maxscale/libreadwritesplit.so
Dec 15 13:21:57 maxscale maxscale[13140]: Loaded module maxscaled: V2.0.0 from /usr/lib64/maxscale/libmaxscaled.so
Dec 15 13:21:57 maxscale maxscale[13140]: Loaded module MaxAdminAuth: V2.1.0 from /usr/lib64/maxscale/libMaxAdminAuth.so
Dec 15 13:21:57 maxscale maxscale[13140]: No query classifier specified, using default 'qc_sqlite'.
Dec 15 13:21:57 maxscale maxscale[13140]: Loaded module qc_sqlite: V1.0.0 from /usr/lib64/maxscale/libqc_sqlite.so
Dec 15 13:21:57 maxscale maxscale[13140]: Service 'rwsplit-service' has no listeners defined.
Dec 15 13:21:57 maxscale maxscale[13140]: Listening for connections at [/tmp/maxadmin.sock]:0 with protocol MaxScale Admin
Dec 15 13:21:57 maxscale maxscale[13140]: MaxScale started with 1 server threads.
Dec 15 13:21:57 maxscale maxscale[13140]: Started MaxScale log flusher.
Dec 15 13:21:57 maxscale systemd[1]: Started MariaDB MaxScale Database Proxy.

At this point, the maxscale does not have anything to report in but the service we configured on the basic configuration file. That is mandatory to start Maxscale and make it happy on the first basic initialization. The log events above can show you that maxscale was started with a service but not a listener, not a monitor and no servers. So, this is what we’re going to create now, running the below commands while checking the Maxscale’s log file (below were extracted from this blog from Marküs Mäkelä and adjusted/fixed on this JIRA):

#: let's create a monitor based on the "mysqlmon"
[root@maxscale maxscale_configs]# maxadmin create monitor cluster-monitor mysqlmon
Created monitor 'cluster-monitor'
 
#: log file will tell the below
2017-10-10 15:34:31   notice : (3) [mysqlmon] Initialise the MySQL Monitor module.

#: let's alter the monitor to add some options 
[root@maxscale maxscale_configs]# maxadmin alter monitor cluster-monitor user=maxuser_ssl password=AF76BE841B5B4692D820A49298C00272 monitor_interval=10000
 
#: log file will tell you about the last changes
2017-10-10 15:34:31   notice : (3) Loaded module mysqlmon: V1.5.0 from /usr/lib64/maxscale/libmysqlmon.so
2017-10-10 15:34:31   notice : (3) Created monitor 'cluster-monitor'
2017-10-10 15:35:03   notice : (4) Updated monitor 'cluster-monitor': type=monitor
2017-10-10 15:35:03   notice : (4) Updated monitor 'cluster-monitor': user=maxuser_ssl
2017-10-10 15:35:03   notice : (4) Updated monitor 'cluster-monitor': password=AF76BE841B5B4692D820A49298C00272
2017-10-10 15:35:03   notice : (4) Updated monitor 'cluster-monitor': monitor_interval=1000

#: let's restart the monitor to take changes in effect
[root@maxscale maxscale_configs]# maxadmin restart monitor cluster-monitor
2017-10-10 18:40:50   error  : [mysqlmon] No Master can be determined

#: let's list existing monitors
[root@maxscale maxscale_configs]# maxadmin list monitors
---------------------+---------------------
Monitor              | Status
---------------------+---------------------
cluster-monitor      | Running
---------------------+---------------------

#: let’s create the listener, adding the client certificates for the connections
[root@maxscale maxscale.cnf.d]# maxadmin create listener rwsplit-service rwsplit-listener 0.0.0.0 4006 default default default /etc/my.cnf.d/certs/client-key.pem /etc/my.cnf.d/certs/client-cert.pem /etc/my.cnf.d/certs/ca-cert.pem
Listener 'rwsplit-listener' created
 
#: this is what log events tells us
2017-11-22 23:26:18 notice : (5) Using encrypted passwords. Encryption key: '/var/lib/maxscale/.secrets'.
2017-11-22 23:26:18 notice : (5) [MySQLAuth] [rwsplit-service] No users were loaded but 'inject_service_user' is enabled. Enabling service credentials for authentication until database users have been successfully loaded.
2017-11-22 23:26:18 notice : (5) Listening for connections at [0.0.0.0]:4006 with protocol MySQL
2017-11-22 23:26:18 notice : (5) Created TLS encrypted listener 'rwsplit-listener' at 0.0.0.0:4006 for service 'rwsplit-service'

#: listing the existing listeners 
[root@maxscale maxscale.cnf.d]# maxadmin list listeners
Listeners.

-----------------+---------------------+--------------------+-----------------+-------+--------
Name             | Service Name        | Protocol Module    | Address         | Port  | State
-----------------+---------------------+--------------------+-----------------+-------+--------
rwsplit-listener | rwsplit-service     | MySQLClient        | 0.0.0.0         | 4006  | Running
CLI Listener     | CLI                 | maxscale           | default         | 0     | Running
-----------------+---------------------+--------------------+-----------------+-------+--------

Here is the point in which you need to create the servers and then, you need alter the server’s configurations to add the SSL certificates, let’s see:

#: creating the server prod_mariadb01 and alter its configurations to add SSL
[root@maxscale ~]# maxadmin create server prod_mariadb01 192.168.50.11 3306
Created server 'prod_mariadb01'

[root@maxscale ~]# maxadmin alter server prod_mariadb01 ssl=required ssl_key=/etc/my.cnf.d/certs/client-key.pem ssl_cert=/etc/my.cnf.d/certs/client-cert.pem ssl_ca_cert=/etc/my.cnf.d/certs/ca-cert.pem

#: creating the server prod_mariadb02 and alter its configurations to add SSL
[root@maxscale ~]# maxadmin create server prod_mariadb02 192.168.50.12 3306
Created server 'prod_mariadb02'

[root@maxscale ~]# maxadmin alter server prod_mariadb02 ssl=required ssl_key=/etc/my.cnf.d/certs/client-key.pem ssl_cert=/etc/my.cnf.d/certs/client-cert.pem ssl_ca_cert=/etc/my.cnf.d/certs/ca-cert.pem
 
#: creating the server prod_mariadb03 and alter its configurations to add SSL
[root@maxscale ~]# maxadmin create server prod_mariadb03 192.168.50.13 3306
Created server 'prod_mariadb03'

[root@maxscale ~]# maxadmin alter server prod_mariadb03 ssl=required ssl_key=/etc/my.cnf.d/certs/client-key.pem ssl_cert=/etc/my.cnf.d/certs/client-cert.pem ssl_ca_cert=/etc/my.cnf.d/certs/ca-cert.pem

#: maxscale logs should be like
2017-12-02 18:56:28   notice : (19) Loaded module MySQLBackend: V2.0.0 from /usr/lib64/maxscale/libMySQLBackend.so
2017-12-02 18:56:28   notice : (19) Loaded module MySQLBackendAuth: V1.0.0 from /usr/lib64/maxscale/libMySQLBackendAuth.so
2017-12-02 18:56:28   notice : (19) Created server 'prod_mariadb01' at 192.168.50.11:3306
2017-12-02 18:57:57   notice : (20) Enabled SSL for server 'prod_mariadb01'
2017-12-02 19:00:42   notice : (22) Created server 'prod_mariadb02' at 192.168.50.12:3306
2017-12-02 19:00:49   notice : (23) Enabled SSL for server 'prod_mariadb02'
2017-12-02 19:00:58   notice : (24) Created server 'prod_mariadb03' at 192.168.50.13:3306
2017-12-02 19:01:04   notice : (25) Enabled SSL for server 'prod_mariadb03'

It’s good to say that MySQLBackend and MySQLBackedAuth are default values for the server’s protocol and the authenticator module respectively and those values are assumed by default when it’s omitted when creating servers. At this point we can show servers to see the servers configured with the SSL certificates:

[root@maxscale ~]# maxadmin show servers | grep -i ssl
    SSL initialized:                     yes
    SSL method type:                     MAX
    SSL certificate verification depth:  9
    SSL certificate:                     /etc/my.cnf.d/certs/client-cert.pem
    SSL key:                             /etc/my.cnf.d/certs/client-key.pem
    SSL CA certificate:                  /etc/my.cnf.d/certs/ca-cert.pem

And then, we can list servers, and you will see that, it’s not yet recognized by Maxscale being neither master or slave:

[root@maxscale maxscale_configs]# maxadmin list servers
Servers.
-------------------+-----------------+-------+-------------+--------------------
Server             | Address         | Port  | Connections | Status
-------------------+-----------------+-------+-------------+--------------------
prod_mysql03       | 192.168.50.13   |  3306 |           0 | Running
prod_mysql02       | 192.168.50.12   |  3306 |           0 | Running
prod_mysql01       | 192.168.50.11   |  3306 |           0 | Running
-------------------+-----------------+-------+-------------+--------------------

Next step is to add the created servers to the monitor and service; both created previously as well:

[root@maxscale maxscale_configs]# maxadmin add server prod_mariadb01 cluster-monitor rwsplit-service
Added server 'prod_mysql01' to 'cluster-monitor'
Added server 'prod_mysql01' to 'rwsplit-service’

[root@maxscale maxscale_configs]# maxadmin add server prod_mariadb02 cluster-monitor rwsplit-service
Added server 'prod_mysql02' to 'cluster-monitor'
Added server 'prod_mysql02' to 'rwsplit-service'

[root@maxscale maxscale_configs]# maxadmin add server prod_mariadb03 cluster-monitor rwsplit-service
Added server 'prod_mysql03' to 'cluster-monitor'
Added server 'prod_mysql03' to 'rwsplit-service’

#: logs
2017-10-10 18:45:45   notice : (16) Added server 'prod_mysql01' to monitor 'cluster-monitor'
2017-10-10 18:45:45   notice : (16) Added server 'prod_mysql01' to service 'rwsplit-service'
2017-10-10 18:45:45   notice : Server changed state: prod_mysql01[192.168.50.11:3306]: new_master. [Running] -> [Master, Running]
2017-10-10 18:45:45   notice : [mysqlmon] A Master Server is now available: 192.168.50.11:3306
2017-10-10 18:45:52   notice : (17) Added server 'prod_mysql02' to monitor 'cluster-monitor'
2017-10-10 18:45:52   notice : (17) Added server 'prod_mysql02' to service 'rwsplit-service'
2017-10-10 18:45:53   notice : Server changed state: prod_mysql01[192.168.50.11:3306]: lost_master. [Master, Running] -> [Running]
2017-10-10 18:45:53   error  : [mysqlmon] No Master can be determined
2017-10-10 18:45:56   notice : (18) Added server 'prod_mysql03' to monitor 'cluster-monitor'
2017-10-10 18:45:56   notice : (18) Added server 'prod_mysql03' to service 'rwsplit-service'
2017-10-10 18:45:56   notice : Server changed state: prod_mysql01[192.168.50.11:3306]: new_master. [Running] -> [Master, Running]
2017-10-10 18:45:56   notice : Server changed state: prod_mysql03[192.168.50.13:3306]: new_slave. [Running] -> [Slave, Running]
2017-10-10 18:45:56   notice : [mysqlmon] A Master Server is now available: 192.168.50.11:3306

You can see that, when adding servers to the service, which is the ReadWriteSplit, the current servers’ states and their roles pops up.

[root@maxscale ~]# maxadmin list servers
Servers.
-------------------+-----------------+-------+-------------+--------------------
Server             | Address         | Port  | Connections | Status
-------------------+-----------------+-------+-------------+--------------------
prod_mariadb01     | 192.168.50.11   |  3306 |           0 | Master, Running
prod_mariadb02     | 192.168.50.12   |  3306 |           0 | Slave, Running
prod_mariadb03     | 192.168.50.13   |  3306 |           0 | Slave, Running
-------------------+-----------------+-------+-------------+--------------------

Yet, all the configurations are modular and you can find all files created based on the dynamic configurations we have done until now at /var/lib/maxscale/maxscale.cnf.d:

[root@maxscale maxscale.cnf.d]# ls -lh
total 24K
-rw-r--r-- 1 root root 251 Dec  2 19:10 cluster-monitor.cnf
-rw-r--r-- 1 root root 299 Dec  2 18:57 prod_mariadb01.cnf
-rw-r--r-- 1 root root 299 Dec  2 19:00 prod_mariadb02.cnf
-rw-r--r-- 1 root root 299 Dec  2 19:01 prod_mariadb03.cnf
-rw-r--r-- 1 root root 313 Nov 22 23:26 rwsplit-listener.cnf
-rw-r--r-- 1 root root  71 Dec  2 19:10 rwsplit-service.cnf

SSL configurations will be on rwsplit-listener.cnf and on servers’ files:

[root@maxscale maxscale.cnf.d]# cat rwsplit-listener.cnf
[rwsplit-listener]
type=listener
protocol=MySQLClient
service=rwsplit-service
address=0.0.0.0
port=4006
authenticator=MySQLAuth
ssl=required
ssl_cert=/etc/my.cnf.d/certs/client-cert.pem
ssl_key=/etc/my.cnf.d/certs/client-key.pem
ssl_ca_cert=/etc/my.cnf.d/certs/ca-cert.pem
ssl_cert_verify_depth=9
ssl_version=MAX
 
[root@maxscale maxscale.cnf.d]# cat prod_mariadb0*
[prod_mariadb01]
type=server
protocol=MySQLBackend
address=192.168.50.11
port=3306
authenticator=MySQLBackendAuth
ssl=required
ssl_cert=/etc/my.cnf.d/certs/client-cert.pem
ssl_key=/etc/my.cnf.d/certs/client-key.pem
ssl_ca_cert=/etc/my.cnf.d/certs/ca-cert.pem
ssl_cert_verify_depth=9
ssl_version=MAX
 
[prod_mariadb02]
type=server
protocol=MySQLBackend
address=192.168.50.12
port=3306
authenticator=MySQLBackendAuth
ssl=required
ssl_cert=/etc/my.cnf.d/certs/client-cert.pem
ssl_key=/etc/my.cnf.d/certs/client-key.pem
ssl_ca_cert=/etc/my.cnf.d/certs/ca-cert.pem
ssl_cert_verify_depth=9
ssl_version=MAX
 
[prod_mariadb03]
type=server
protocol=MySQLBackend
address=192.168.50.13
port=3306
authenticator=MySQLBackendAuth
ssl=required
ssl_cert=/etc/my.cnf.d/certs/client-cert.pem
ssl_key=/etc/my.cnf.d/certs/client-key.pem
ssl_ca_cert=/etc/my.cnf.d/certs/ca-cert.pem
ssl_cert_verify_depth=9
ssl_version=MAX

At this point, as everything is set up, you can test the access to your databases through Maxscale, using the appuser_ssl (If you haven’t created that user yet, create it now on the master and check authentication). You will notice the below event added to the Maxscale’s log as of when you create new users as Maxscale will update its internal information about users on backends:

2017-12-03 00:15:17   notice : [MySQLAuth] [rwsplit-service] Loaded 15 MySQL users for listener rwsplit-listener.

If you have the user created, as we did create it before, place the below contents at the home directory of your user and test the access with the appuser_ssl user.

#: check if mysql client is present on Maxscale server
[root@maxscale ~]# which mysql
/bin/mysql

#: add the .my.cnf at your user's home directory
[root@maxscale ~]# cat .my.cnf
[client]
ssl
ssl-ca=/etc/my.cnf.d/certs/ca-cert.pem
ssl-cert=/etc/my.cnf.d/certs/client-cert.pem
ssl-key=/etc/my.cnf.d/certs/client-key.pem
[mysql]
ssl
ssl-ca=/etc/my.cnf.d/certs/ca-cert.pem
ssl-cert=/etc/my.cnf.d/certs/client-cert.pem
ssl-key=/etc/my.cnf.d/certs/client-key.pem

To execute the below test you will need to install MariaDB-client package on the MariaDB Maxscale server host.

[root@maxscale ~]# mysql -u appuser_ssl -p123456 -h 192.168.50.100 -P 4006 -e "select @@server_id\G"
*************************** 1. row ***************************
@@server_id: 2

[root@maxscale ~]# mysql -u appuser_ssl -p123456 -h 192.168.50.100 -P 4006 -e "select @@server_id\G"
*************************** 1. row ***************************
@@server_id: 3

Conclusion

It’s a very dense reading, full of practices, bells and, whittles, but, it’s going to serve as a reference for you when implementing MariaDB Maxscale thinking of having it safe, with traffic going over SSL. This is not only about Maxscale, but, about having MariaDB Servers with data being replicated using SSL certificates as well.

Remember that, as Maxscale Dynamic Commands made it possible to configure ReadWriteSplit with mysqlmon, it gives you the same as well to work with galeramon. The product is becoming more and more versatile and the main point to hilight, it’s making the task to position a load balancer or an intelligent database proxy between backends and the clients an easy thing.

AddThis Social Bookmark Button

Multiple MariaDB Instances and systemd units

outubro 25th, 2017 | by: Bianchi | Posted in: Data Infrastructure | 1 Comment »

First of all 😀 if you expect to read something really advanced level, this blog is not for you, just go read another stuff, 😉 I’m saving you some time.

Today I was caught by surprise with a request to help a good friend from Consulting side of the world. As I got very curious to execute this in production considering all the possible barriers I could ever be about to face, I start the project on my local lab to execute the following task:

How to get multiple instances of MariaDB Server running on the same machine and have systemd units for each one of them. Ok, it should be trivial, but, as I’m a hands on guy, I need to put things together to make sense of it and check if it really works. Alright, I have to say that I don’t like the idea to have multiple instances running in one server, as it can be such a big single point of failure as if your hardware has never failed before, it’s gonna fail and everything will just sync altogether. All instances you have, just down and it’s bad, really bad, very bad, you don’t wanna that. Any way, let’s put things together to make sense out of it and show you how I organized stuff.

First of all, you need to download a tar.gz of the MariaDB of the version you want to have running. I got the below:

1
2
3
4
5
6
7
8
9
10
[root@localhost ~]# wget https://downloads.mariadb.org/interstitial/mariadb-5.5.56/bintar-linux-x86_64/mariadb-5.5.56-linux-x86_64.tar.gz/from/http%3A//mirror.ufscar.br/mariadb/
--2017-10-25 13:18:41--  https://downloads.mariadb.org/interstitial/mariadb-5.5.56/bintar-linux-x86_64/mariadb-5.5.56-linux-x86_64.tar.gz/from/http%3A//mirror.ufscar.br/mariadb/
Resolving downloads.mariadb.org (downloads.mariadb.org)... 173.203.201.148
Connecting to downloads.mariadb.org (downloads.mariadb.org)|173.203.201.148|:443... connected.
…
[root@localhost ~]# ls -lh
total 214M
-rw-------. 1 root root 1.5K Jan 27  2016 anaconda-ks.cfg
-rw-r--r--  1 root root 214M Apr 30 12:29 mariadb-5.5.56-linux-x86_64.tar.gz
…

At this point what you need to do is, create the directories to be the database servers BASEDIR e the mysql user:

1
2
3
[root@localhost ~]# mkdir -p /var/lib/mysql/inst01
[root@localhost ~]# mkdir -p /var/lib/mysql/inst02
[root@localhost ~]# adduser mysql -s /sbin/nologin

Gunzip the files:

1
2
3
4
5
6
[root@localhost ~]# tar xvzf mariadb-5.5.56-linux-x86_64.tar.gz
mariadb-5.5.56-linux-x86_64/README
mariadb-5.5.56-linux-x86_64/COPYING
mariadb-5.5.56-linux-x86_64/EXCEPTIONS-CLIENT
mariadb-5.5.56-linux-x86_64/INSTALL-BINARY
…

Copy files to previously created BASEDIR locations:

1
2
[root@localhost ~]# cp -r mariadb-5.5.56-linux-x86_64/* /var/lib/mysql/inst01
[root@localhost ~]# cp -r mariadb-5.5.56-linux-x86_64/* /var/lib/mysql/inst02

Configure the ownership and permissions:

1
2
[root@localhost inst01]# chown -R mysql:mysql /var/lib/mysql/inst01/
[root@localhost inst01]# chown -R mysql:mysql /var/lib/mysql/inst02/

In the defined BASEDIR locations, create a small my.cnf file:

1
2
3
4
5
6
7
8
9
10
11
12
13
14
15
16
17
18
19
20
21
22
23
24
25
26
27
28
29
30
31
32
[root@localhost mysql]# pwd
/var/lib/mysql
 
[root@localhost mysql]# cat inst01/my.cnf
[mysqld]
server_id=1
user=mysql
basedir=/var/lib/mysql/inst01/
datadir=/var/lib/mysql/inst01/data
port=3310
socket=/var/lib/mysql/inst01/mysql.socket
innodb-data-home-dir=/var/lib/mysql/inst01
innodb-data-file-path=ibdata1:12M:autoextend
innodb-log-file-size=5M
innodb-log-group-home-dir=/var/lib/mysql/inst01
log-error=/var/lib/mysql/inst01/inst01.err
skip-grant-tables
 
[root@localhost mysql]# cat inst02/my.cnf
[mysqld]
server_id=2
user=mysql
basedir=/var/lib/mysql/inst02/
datadir=/var/lib/mysql/inst02/data
port=3311
socket=/var/lib/mysql/inst02/mysql.socket
innodb-data-home-dir=/var/lib/mysql/inst02
innodb-data-file-path=ibdata1:12M:autoextend
innodb-log-file-size=5M
innodb-log-group-home-dir=/var/lib/mysql/inst02
log-error=/var/lib/mysql/inst01/inst02.err
skip-grant-tables

You can test the server’s start using the below command, but, as I tested that and saw that everything is OK, now it’s time to rock it inside new system units to make it possible to have a clear separation of the both MariaDB Servers running on the same box. I will call the MariaDB running on 3310, mariadb01.service and the one running on port 3311, mariadb02.service and then, I will reload the system units and start the services.

1
2
3
4
5
6
7
8
9
10
11
12
13
14
15
16
17
18
19
20
21
#: commands we need for the units
/var/lib/mysql/inst01/bin/mysqld_safe --defaults-file=/var/lib/mysql/inst01/my.cnf
/var/lib/mysql/inst02/bin/mysqld_safe --defaults-file=/var/lib/mysql/inst02/my.cnf
 
#: create the unit file
vim /etc/systemd/system/mariadb01.service
 
#: add the below to the mariadb01’s unit
[Unit]
Description=mariadb inst01
After=network.target
 
[Service]
Type=simple
User=mysql
ExecStart=/var/lib/mysql/inst01/bin/mysqld_safe --defaults-file=/var/lib/mysql/inst01/my.cnf
Restart=on-abort
 
 
[Install]
WantedBy=multi-user.target

Do the same for the second one, which is the mariadb02 and enable them:

1
2
3
4
[root@localhost mysql]# systemctl enable mariadb01.service
Created symlink from /etc/systemd/system/multi-user.target.wants/mariadb01.service to /etc/systemd/system/mariadb01.service.
[root@localhost mysql]# systemctl enable mariadb02.service
Created symlink from /etc/systemd/system/multi-user.target.wants/mariadb02.service to /etc/systemd/system/mariadb02.service.

Are them really enabled?

1
2
3
4
[root@localhost mysql]# systemctl is-enabled mariadb01.service
enabled
[root@localhost mysql]# systemctl is-enabled mariadb02.service
enabled

Reload them:

[root@localhost mysql]# systemctl daemon-reload

And rock it (start/status):

1
2
3
4
5
6
7
8
9
10
11
12
13
14
15
16
17
18
19
20
21
22
23
24
25
26
27
28
29
30
31
32
33
34
35
36
37
38
39
40
41
42
43
#: check if any mysqld processes are running
[root@localhost ~]# ps aux | grep mysqld
root     14487  0.0  0.1 112644   952 pts/1    S+   21:03   0:00 grep --color=auto mysqld
 
#: start the first instance on 3310 and check status
[root@localhost mysql]# systemctl start mariadb01.service
[root@localhost mysql]# systemctl status mariadb01.service
● mariadb01.service - mariadb inst01
   Loaded: loaded (/etc/systemd/system/mariadb01.service; enabled; vendor preset: disabled)
   Active: active (running) since Wed 2017-10-25 21:04:25 BST; 4s ago
 Main PID: 14493 (mysqld_safe)
   CGroup: /system.slice/mariadb01.service
           ├─14493 /bin/sh /var/lib/mysql/inst01/bin/mysqld_safe --defaults-file=/var/lib/mysql/inst01/my.cnf
           └─14712 /var/lib/mysql/inst01/bin/mysqld --defaults-file=/var/lib/mysql/inst01/my.cnf --basedir=/var/lib/mysql/inst01/ --datadir=/var/lib/mysql/inst01/data --plugin-dir=...
 
Oct 25 21:04:25 localhost.localdomain systemd[1]: Started mariadb inst01.
Oct 25 21:04:25 localhost.localdomain systemd[1]: Starting mariadb inst01...
Oct 25 21:04:25 localhost.localdomain mysqld_safe[14493]: 171025 21:04:25 mysqld_safe Logging to '/var/lib/mysql/inst01/inst01.err'.
Oct 25 21:04:25 localhost.localdomain mysqld_safe[14493]: 171025 21:04:25 mysqld_safe Starting mysqld daemon with databases from /var/lib/mysql/inst01/data
 
#: start the first instance on 3311 and check status
[root@localhost mysql]# systemctl start mariadb02.service
[root@localhost mysql]# systemctl status mariadb02.service
● mariadb02.service - mariadb inst02
   Loaded: loaded (/etc/systemd/system/mariadb02.service; enabled; vendor preset: disabled)
   Active: active (running) since Wed 2017-10-25 21:05:11 BST; 3s ago
 Main PID: 14741 (mysqld_safe)
   CGroup: /system.slice/mariadb02.service
           ├─14741 /bin/sh /var/lib/mysql/inst02/bin/mysqld_safe --defaults-file=/var/lib/mysql/inst02/my.cnf
           └─14960 /var/lib/mysql/inst02/bin/mysqld --defaults-file=/var/lib/mysql/inst02/my.cnf --basedir=/var/lib/mysql/inst02/ --datadir=/var/lib/mysql/inst02/data --plugin-dir=...
 
Oct 25 21:05:11 localhost.localdomain systemd[1]: Started mariadb inst02.
Oct 25 21:05:11 localhost.localdomain systemd[1]: Starting mariadb inst02...
Oct 25 21:05:11 localhost.localdomain mysqld_safe[14741]: 171025 21:05:11 mysqld_safe Logging to '/var/lib/mysql/inst01/inst02.err'.
Oct 25 21:05:11 localhost.localdomain mysqld_safe[14741]: 171025 21:05:11 mysqld_safe Starting mysqld daemon with databases from /var/lib/mysql/inst02/data
 
#: checking ps again
[root@localhost ~]# ps aux | grep mysqld
mysql    14493  0.0  0.2 113252  1612 ?        Ss   21:04   0:00 /bin/sh /var/lib/mysql/inst01/bin/mysqld_safe --defaults-file=/var/lib/mysql/inst01/my.cnf
mysql    14712  0.1 12.8 660512 80908 ?        Sl   21:04   0:00 /var/lib/mysql/inst01/bin/mysqld --defaults-file=/var/lib/mysql/inst01/my.cnf --basedir=/var/lib/mysql/inst01/ --datadir=/var/lib/mysql/inst01/data --plugin-dir=/var/lib/mysql/inst01//lib/plugin --log-error=/var/lib/mysql/inst01/inst01.err --pid-file=localhost.localdomain.pid --socket=/var/lib/mysql/inst01/mysql.socket --port=3310
mysql    14741  0.0  0.2 113252  1620 ?        Ss   21:05   0:00 /bin/sh /var/lib/mysql/inst02/bin/mysqld_safe --defaults-file=/var/lib/mysql/inst02/my.cnf
mysql    14960  0.2 12.0 660512 75628 ?        Sl   21:05   0:00 /var/lib/mysql/inst02/bin/mysqld --defaults-file=/var/lib/mysql/inst02/my.cnf --basedir=/var/lib/mysql/inst02/ --datadir=/var/lib/mysql/inst02/data --plugin-dir=/var/lib/mysql/inst02//lib/plugin --log-error=/var/lib/mysql/inst01/inst02.err --pid-file=localhost.localdomain.pid --socket=/var/lib/mysql/inst02/mysql.socket --port=3311
root     14985  0.0  0.1 112644   956 pts/1    S+   21:05   0:00 grep --color=auto mysqld

And now, just to finish it, let’s access the instances:

[root@localhost mysql]# /var/lib/mysql/inst01/bin/mysql --socket=/var/lib/mysql/inst01/mysql.socket --prompt="inst01 [\d]&gt; "
Welcome to the MariaDB monitor.  Commands end with ; or \g.
Your MariaDB connection id is 3
Server version: 5.5.56-MariaDB MariaDB Server
 
Copyright (c) 2000, 2017, Oracle, MariaDB Corporation Ab and others.
 
Type 'help;' or '\h' for help. Type '\c' to clear the current input statement.
 
inst01 [(none)]&gt; \q
Bye
[root@localhost mysql]# /var/lib/mysql/inst01/bin/mysql --socket=/var/lib/mysql/inst02/mysql.socket --prompt="inst02 [\d]&gt; "
Welcome to the MariaDB monitor.  Commands end with ; or \g.
Your MariaDB connection id is 1
Server version: 5.5.56-MariaDB MariaDB Server
 
Copyright (c) 2000, 2017, Oracle, MariaDB Corporation Ab and others.
 
Type 'help;' or '\h' for help. Type '\c' to clear the current input statement.
 
inst02 [(none)]&gt; \q
Bye

A very popular related case is https://ma.ttias.be/increase-open-files-limit-in-mariadb-on-centos-7-with-systemd/ !

So, that’s it.

AddThis Social Bookmark Button

MariaDB 10.3 PL/SQL I

outubro 17th, 2017 | by: Bianchi | Posted in: MariaDB New Features, MariaDB PL/SQL | 3 Comments »

Since MariaDB Corporation started with the project to bring the PL/SQL and other Oracle-based functionalities to MariaDB Sever, I’ve got very curious and started having a looking around to see how was that going. Most of the time, what calls the attention of database and system administrators, or Database Operations guys is the new things that pop up times to times and makes it worst checking and testing. At this time, it was not any different, as I worked with PL/SQL before, I felt that it is a giant step for MariaDB users to put together SQL script in a more structured way. I am not saying that the standards supported natively by MariaDB is not good, I am just saying that it could be good to innovate and get new procedural scripts writing on SQL to use the PL/SQL features.

The first step is really to get a server of your preference running MariaDB 10.3 ++ to get the features announced here https://mariadb.com/kb/en/library/mariadb-1030-release-notes/. For the time I’m writing this blog post, 10.3.1 is the latest release of the MariaDB 10.3 series, which has the following changelog, https://mariadb.com/kb/en/library/mariadb-1031-release-notes/. Regardless of the InnoDB 5.7.19 being added to MariaDB removing the XtraDB Storage Engine e many other new things, this blog post will be dedicated mainly to write code in PL/SQL, observing all the features that were released until now on MariaDB 10.3.1.

After getting the MariaDB Server 10.3.1++ running on your system, I’m running that on a CentOS 7.3, just for the records, you need to add the initial configurations to make the MariaDB Server (you must pay attention to the version, it’s important) to understand the PL/SQL and that’s done configuring the global variable @@sql_mode with Oracle as its value, as you can see below:

#: /etc/my.cnf.d/server.cnf | grep sql_mode
[mysqld]
sql_mode=oracle

You may get in doubt where you place the sql_mode configs, so you can follow what is being shown above. Edit the file /etc/my.cnf.d/server.cnf and add the sql_mode=oracle under the [mysqld] section, it’s gonna work for you as it worked for me. An alternative you have is to set the @@sql_mode value globally on the runtime, so, you can have it until the next start.

MariaDB [(none)]&gt; SELECT @@sql_mode;
+------------+
| @@sql_mode |
+------------+
|            |
+------------+
1 row in set (0.001 sec)
 
MariaDB [(none)]&gt; SET GLOBAL sql_mode=ORACLE;
Query OK, 0 rows affected (0.000 sec)
 
MariaDB [(none)]&gt; SELECT @@sql_mode\G
*************************** 1. row ***************************
@@sql_mode: PIPES_AS_CONCAT,ANSI_QUOTES,IGNORE_SPACE,ORACLE,NO_KEY_OPTIONS,
            NO_TABLE_OPTIONS,NO_FIELD_OPTIONS,NO_AUTO_CREATE_USER
1 row in set (0.000 sec)

By the way, it’s important to add the configs to yours MariaDB Server’s configuration file to avoid for PL/SQL programs to stop working after a restart. You need to be aware that, when you enable the @@sql_mode as ORACLE to be able to use the PL/SQL on MariaDB 10.3, the native MySQL’s syntax for creating routines which adhere is fairly close to the SQL:2003 standard won’t be available anymore – any attempts to develop a native SQL procedure is going to fail with a problem on recognizing syntax.

MariaDB [mydb]&gt; delimiter /
MariaDB [mydb]&gt; create procedure p1 (a int)
    -&gt; begin
    -&gt;     declare var int default 0;
    -&gt;     while a &gt; var do
    -&gt;         insert into t1 set i=var;
    -&gt;         set var = var +1;
    -&gt;     end while;
    -&gt; end;
    -&gt; /
ERROR 1064 (42000): You have an error in your SQL syntax; check the manual that corresponds to your MariaDB server version for the right syntax to use near 'begin
    declare var int default 0;
    while a &gt; var do
        insert into t1' at line 3
Query OK, 0 rows affected (0.000 sec)

As we are running MariaDB 10.3 with @@sql_mode as oracle, I’m going to create a table and will create in a sequence a simple PL/SQL procedure that will prepares (parses) and immediately executes the defined dynamic SQL statement.

The created table:

MariaDB [mydb]&gt; show create table t1/
+-------+-------------------------------------------------------------------+
| Table | Create Table                                                      |
+-------+-------------------------------------------------------------------+
| t1    | CREATE TABLE "t1" (
  "i" int(11) NOT NULL,
  PRIMARY KEY ("i")
) |
+-------+-------------------------------------------------------------------+
1 row in set (0.000 sec)

The PL/SQL simple procedure with a static value to be inserted on table mydb.t1:

MariaDB [mydb]&gt; delimiter /
MariaDB [mydb]&gt; create or replace procedure p1
    -&gt; as
    -&gt;     a mydb.t1.i%TYPE := 1;
    -&gt; begin
    -&gt;     execute immediate 'insert into mydb.t1 (i) values (:a)' USING a;
    -&gt; end;
    -&gt; /
Query OK, 0 rows affected (0.005 sec)

Now we can call the procedure p1:

MariaDB [mydb]&gt; call mydb.p1/
Query OK, 1 row affected (0.002 sec)
 
MariaDB [mydb]&gt; select * from t1/
+---+
| i |
+---+
| 1 |
+---+
1 row in set (0.000 sec)

But most of the time you want to pass parameters with the value to be inserted on a table and even, being worked by the procedure and then, inserted on tables. For the sake of simplicity, I’m going to pass one parameter to the procedure and then, insert it into the table t1.

Creating the procedure p2:

MariaDB [mydb]&gt; delimiter /
MariaDB [mydb]&gt; create or replace procedure p2 (i int)
    -&gt; as
    -&gt;     a mydb.t1.i%TYPE := i;
    -&gt; begin
    -&gt;     execute immediate 'insert into mydb.t1 (i) values (:a)' USING a;
    -&gt; end;
    -&gt; /
Query OK, 0 rows affected (0.002 sec)

Calling the procedure p2:

MariaDB [mydb]&gt; call p2(100)/
Query OK, 1 row affected (0.003 sec)
 
MariaDB [mydb]&gt; select * from t1/
+-----+
| i   |
+-----+
|   1 |
| 100 |
+-----+
2 rows in set (0.000 sec)

Conclusion

This small article shows you how to configure MariaDB 10.3, already available for download at MariaDB website, to be configured with @@sql_mode as oracle as it permits you to create procedures. Functions, triggers, packages, etc using PL/SQL, the Oracle’s procedural language. On a next blog, I’m going to bring up more sophisticated constructions for the support MariaDB has to PL/SQL.

AddThis Social Bookmark Button

MySQL InnoDB Cluster, now with remote nodes!

setembro 25th, 2016 | by: Bianchi | Posted in: MySQL Tuning | No Comments »

screen-shot-2016-09-25-at-10-48-55-amIn this post I’m going to extend the tests I made with MySQL InnoDB Cluster on the previous post, creating a group of instances with separate servers, that is, I’m going to test how to create a new cluster with three different machines considering that, if you create a cluster using one giant server, maybe it may be considered a big single point of failure in case this giant server crashes and all cluster’s members crashes altogether.

In this case, we know that, to prevent that situation is something that is part of any project using a database which principle is to scale-out in order to attend more and more data requests. This is a subject for another blog in which we can discuss the main strategies to slave writes and reads and go beyond of the scope of this current post.

I’m going to concentrate here in creating the cluster with 3 machines, I’m using vagrant to create them and the following is the script that will create the virtual machines:

1
2
3
4
5
6
7
8
9
10
11
12
13
14
15
16
17
18
19
20
21
22
23
24
# -*- mode: ruby -*-
# vi: set ft=ruby :
 
VAGRANTFILE_API_VERSION = "2"
 
Vagrant.configure(VAGRANTFILE_API_VERSION) do |config|
  config.vm.define "box01" do |box01|
	box01.vm.hostname="box01"
	box01.vm.box = "centos7.0_x86_64"
	box01.vm.network "private_network", ip: "192.168.50.11", virtualbox__intnet: "mysql_innodb_cluster"
  end
 
  config.vm.define "box02" do |box02|
	box02.vm.hostname="box02"
        box02.vm.box = "centos7.0_x86_64"
        box02.vm.network "private_network", ip: "192.168.50.12", virtualbox__intnet: "mysql_innodb_cluster"
  end
 
  config.vm.define "box03" do |box03|
        box03.vm.hostname="box03"
        box03.vm.box = "centos7.0_x86_64"
        box03.vm.network "private_network", ip: "192.168.50.13", virtualbox__intnet: "mysql_innodb_cluster"
  end
end

I’m considering the you have added a CentOS 7 image to your local vagrant boxes library and that you’re using the VirtualBox hypervisor driver to create virtual machines. If there is something different than this on your setup, maybe the above script won’t work as expected. Below, machines are running:

wagnerbianchi01-3:mysql_innodb_cluster01 root# vagrant status
Current machine states:
box01                     running (virtualbox)
box02                     running (virtualbox)
box03                     running (virtualbox)

With that, we can start configuring the servers in order to create the cluster. Basically, the steps are like below:

1. Setup all packages on all three servers

On the first server, install all packages including the router one as we are going to bootstrap it on that node. You don’t need to install MySQL Router package on the other two nodes as it’s not needed there. MySQL Shell should be installed on all three nodes. So, below I show you what packages I installed on each of the nodes:

#: box01
  mysql-community-client.x86_64 0:5.7.15-1.labs_gr090.el7
  mysql-community-common.x86_64 0:5.7.15-1.labs_gr090.el7
  mysql-community-devel.x86_64 0:5.7.15-1.labs_gr090.el7
  mysql-community-libs.x86_64 0:5.7.15-1.labs_gr090.el7
  mysql-community-libs-compat.x86_64 0:5.7.15-1.labs_gr090.el7
  mysql-community-server.x86_64 0:5.7.15-1.labs_gr090.el7
  mysql-router.x86_64 0:2.1.0-0.1.labs.el7
  mysql-router-debuginfo.x86_64 0:2.1.0-0.1.labs.el7
  mysql-shell.x86_64 0:1.0.5-0.1.labs.el7
  mysql-shell-debuginfo.x86_64 0:1.0.5-0.1.labs.el7
 
#: box02
  mysql-community-client.x86_64 0:5.7.15-1.labs_gr090.el7
  mysql-community-common.x86_64 0:5.7.15-1.labs_gr090.el7
  mysql-community-devel.x86_64 0:5.7.15-1.labs_gr090.el7
  mysql-community-libs.x86_64 0:5.7.15-1.labs_gr090.el7
  mysql-community-libs-compat.x86_64 0:5.7.15-1.labs_gr090.el7
  mysql-community-server.x86_64 0:5.7.15-1.labs_gr090.el7
  mysql-shell.x86_64 0:1.0.5-0.1.labs.el7
  mysql-shell-debuginfo.x86_64 0:1.0.5-0.1.labs.el7
 
#: box03
  mysql-community-client.x86_64 0:5.7.15-1.labs_gr090.el7
  mysql-community-common.x86_64 0:5.7.15-1.labs_gr090.el7
  mysql-community-devel.x86_64 0:5.7.15-1.labs_gr090.el7
  mysql-community-libs.x86_64 0:5.7.15-1.labs_gr090.el7
  mysql-community-libs-compat.x86_64 0:5.7.15-1.labs_gr090.el7
  mysql-community-server.x86_64 0:5.7.15-1.labs_gr090.el7
  mysql-shell.x86_64 0:1.0.5-0.1.labs.el7
  mysql-shell-debuginfo.x86_64 0:1.0.5-0.1.labs.el7

To grab all these packages for your testes, click here (http://downloads.mysql.com/snapshots/pb/mysql-innodb-cluster-5.7.15-preview/mysql-innodb-cluster-labs201609-el7-x86_64.rpm.tar.gz)

2. Add the correct configs/setting to mysql configuration file aka my.cnf:

[root@box01 mysql]# cat /etc/my.cnf
[mysqld]
user=mysql
datadir=/var/lib/mysql
socket=/var/lib/mysql/mysql.sock
 
# Disabling symbolic-links is recommended to prevent assorted security risks
symbolic-links=0
 
log-error=/var/log/mysqld.log
pid-file=/var/run/mysqld/mysqld.pid
 
#: innodb cluster configs
server_id=1
binlog_checksum=none
enforce_gtid_consistency=on
gtid_mode=on
log_bin
log_slave_updates
master_info_repository=TABLE
relay_log_info_repository=TABLE
transaction_write_set_extraction=XXHASH64

Make sure you restart mysqld in case you add new configs after having it initialized to have above variables in effect.

3. Initialize mysqld (using the –initialize-insecure and restart service):

[root@box01 ~]# mysqld --initialize-insecure
[root@box01 mysql]# ls -lh
insgesamt 109M
-rw-r----- 1 mysql mysql   56 24. Sep 16:23 auto.cnf
-rw-r----- 1 mysql mysql  169 24. Sep 16:23 box01-bin.000001
-rw-r----- 1 mysql mysql   19 24. Sep 16:23 box01-bin.index
-rw-r----- 1 mysql mysql  413 24. Sep 16:23 ib_buffer_pool
-rw-r----- 1 mysql mysql  12M 24. Sep 16:23 ibdata1
-rw-r----- 1 mysql mysql  48M 24. Sep 16:23 ib_logfile0
-rw-r----- 1 mysql mysql  48M 24. Sep 16:23 ib_logfile1
drwxr-x--- 2 mysql mysql 4,0K 24. Sep 16:23 mysql
drwxr-x--- 2 mysql mysql 8,0K 24. Sep 16:23 performance_schema
drwxr-x--- 2 mysql mysql 8,0K 24. Sep 16:23 sys
[root@box01 mysql]# systemctl restart mysqld.service
[root@box01 mysql]# systemctl status mysqld.service
mysqld.service - MySQL Server
   Loaded: loaded (/usr/lib/systemd/system/mysqld.service; enabled)
   Active: active (running) since Sa 2016-09-24 16:25:13 CEST; 6s ago
  Process: 17112 ExecStart=/usr/sbin/mysqld --daemonize --pid-file=/var/run/mysqld/mysqld.pid $MYSQLD_OPTS (code=exited, status=0/SUCCESS)
  Process: 17095 ExecStartPre=/usr/bin/mysqld_pre_systemd (code=exited, status=0/SUCCESS)
 Main PID: 17116 (mysqld)
   CGroup: /system.slice/mysqld.service
           └─17116 /usr/sbin/mysqld --daemonize --pid-file=/var/run/mysqld/mysqld.pid
 
Sep 24 16:25:12 box01 systemd[1]: Starting MySQL Server...
Sep 24 16:25:13 box01 systemd[1]: Started MySQL Server.

4. Configure the password for root@‘%’ giving the GRANT OPTIONS for this user:

In this step you need to work on giving the right privileges for the root@‘%’ and configure a password for this user which will be used soon to complete the setup. In the next steps which is the verify and validate the instance, you will be prompted this root@‘%’ password, so, follow the below steps on all three nodes:

#: create and configure the root@‘%'
mysql> grant all on *.* to root@'%' identified by 'bianchi' with grant option;
Query OK, 0 rows affected, 1 warning (0,00 sec) -- don’t worry about this warning
 
#: configure the password for root@localhost
mysql> set password='bianchi';
Query OK, 0 rows affected (0,00 sec)
 
#: in any case, flush grants tables
mysql> flush privileges;
Query OK, 0 rows affected (0,00 sec)

5. Validate instances, this is done accessing the MySQL Shell on all the three nodes and run the below command:

mysql-js> dba.validateInstance('root@localhost:3306')
Please provide a password for 'root@localhost:3306':
Validating instance...
 
Running check command.
Checking Group Replication prerequisites.
* Comparing options compatibility with Group Replication... PASS
Server configuration is compliant with the requirements.
* Checking server version... PASS
Server is 5.7.15
 
* Checking that server_id is unique... PASS
The server_id is valid.
 
* Checking compliance of existing tables... PASS
 
The instance: localhost:3306 is valid for Cluster usage

At this point in which we’re going to start accessing instances all around, make sure you configure iptables appropriately or even, just flush all the configured chains on that in order to avoid the below message when accessing remote nodes:

[root@box01 mysql]# mysql -u root -p -h box02
Enter password:
ERROR 2003 (HY000): Can't connect to MySQL server on 'box02' (113)
 
[root@box02 ~]# iptables -F
[root@box02 ~]# systemctl firewalld stop
 
[root@box01 mysql]# mysql -u root -p -h box02
Enter password:
Welcome to the MySQL monitor.  Commands end with ; or \g.
Your MySQL connection id is 4
Server version: 5.7.15-labs-gr090-log MySQL Community Server (GPL)
 
Copyright (c) 2000, 2016, Oracle and/or its affiliates. All rights reserved.
 
Oracle is a registered trademark of Oracle Corporation and/or its
affiliates. Other names may be trademarks of their respective
owners.
 
Type 'help;' or '\h' for help. Type '\c' to clear the current input statement.
 
mysql> \q
Bye

6. At this point, we need to create a cluster:

Let’s use box01 as the server in which we will create the cluster and bootstrap it, creating all the cluster’s metadata.

#: create the cluster on box01
[root@box01 mysql]# mysqlsh
Welcome to MySQL Shell 1.0.5-labs Development Preview
 
Copyright (c) 2016, Oracle and/or its affiliates. All rights reserved.
 
Oracle is a registered trademark of Oracle Corporation and/or its
affiliates. Other names may be trademarks of their respective
owners.
 
Type '\help', '\h' or '\?' for help, type '\quit' or '\q' to exit.
 
Currently in JavaScript mode. Use \sql to switch to SQL mode and execute queries.
mysql-js> \c root@localhost:3306
Creating a Session to 'root@localhost:3306'
Enter password:
Classic Session successfully established. No default schema selected.
 
mysql-js> cluster = dba.createCluster('wbCluster001')
A new InnoDB cluster will be created on instance 'root@localhost:3306'.
 
When setting up a new InnoDB cluster it is required to define an administrative
MASTER key for the cluster. This MASTER key needs to be re-entered when making
changes to the cluster later on, e.g.adding new MySQL instances or configuring
MySQL Routers. Losing this MASTER key will require the configuration of all
InnoDB cluster entities to be changed.
 
Please specify an administrative MASTER key for the cluster 'wbCluster001':
Creating InnoDB cluster 'wbCluster001' on 'root@localhost:3306'...
Adding Seed Instance...
 
Cluster successfully created. Use Cluster.addInstance() to add MySQL instances.
At least 3 instances are needed for the cluster to be able to withstand up to
one server failure.
 
mysql-js>

Now we can use the the value we stored on the variable cluster to exhibit the status of the just created cluster:

1
2
3
4
5
6
7
8
9
10
11
12
13
14
15
16
mysql-js> cluster.status()
{
    "clusterName": "wbCluster001",
    "defaultReplicaSet": {
        "status": "Cluster is NOT tolerant to any failures.",
        "topology": {
            "localhost:3306": {
                "address": "localhost:3306",
                "status": "ONLINE",
                "role": "HA",
                "mode": "R/W",
                "leaves": {}
            }
        }
    }
}

Cluster status at this point shows that it’s not fault tolerant due to don’t have any other node as part of the cluster wbCluster001. Another thing I verified here and it was present on the scenario of the previous post as well, is that the metadata is created on some tables on the database schema called mysql_innodb_cluster_metadata, added to the instance used to create the cluster and that will be the instance to manage the cluster.

#: box01, the instance used as the cluster’s seed
mysql> use mysql_innodb_cluster_metadata
Reading table information for completion of table and column names
You can turn off this feature to get a quicker startup with -A
 
Database changed
mysql> show tables;
+-----------------------------------------+
| Tables_in_mysql_innodb_cluster_metadata |
+-----------------------------------------+
| clusters                                |
| hosts                                   |
| instances                               |
| replicasets                             |
| schema_version                          |
+-----------------------------------------+
5 rows in set (0,00 sec)
 
mysql> select cluster_id,cluster_name from mysql_innodb_cluster_metadata.clusters\G
*************************** 1. row ***************************
  cluster_id: 1
cluster_name: wbCluster001
1 row in set (0,00 sec)

7. Adding instances to the cluster:

By now, what we need to do is to start adding the instances we setup on our existing cluster and to do that, in case you don’t have the cluster’s name on cluster variable anymore, you can use mysqlsh, connect to the instance running on box01:3306 and user the dba.getCluster(‘wbCluster001’) again. After doing that, you can move forward an execute the below addInstances() methods to add instances box02,box03 to the existing cluster.

mysql-js> \c root@192.168.50.11:3306
Creating a Session to 'root@192.168.50.11:3306'
Enter password:
Classic Session successfully established. No default schema selected.
mysql-js> cluster = dba.getCluster('wbCluster001')
When the InnoDB cluster was setup, a MASTER key was defined in order to enable
performing administrative tasks on the cluster.
 
Please specify the administrative MASTER key for the cluster 'wbCluster001':
<Cluster:wbCluster001>
 
#: adding box02
mysql-js> cluster.addInstance('root@192.168.50.12:3306')
A new instance will be added to the InnoDB cluster. Depending on the amount of
data on the cluster this might take from a few seconds to several hours.
 
Please provide the password for 'root@192.168.50.12:3306':
Adding instance to the cluster ...
 
The instance 'root@192.168.50.12:3306' was successfully added to the cluster.
 
#: adding box03
mysql-js> cluster.addInstance('root@192.168.50.13:3306')
A new instance will be added to the InnoDB cluster. Depending on the amount of
data on the cluster this might take from a few seconds to several hours.
 
Please provide the password for 'root@192.168.50.13:3306':
Adding instance to the cluster ...
 
The instance 'root@192.168.50.13:3306' was successfully added to the cluster.

At this point, configuring exactly the way you’re reading above, I saw the error logs on both joiner nodes, box02 and box03, the following messages:

2016-09-25T00:34:11.285509Z 61 [ERROR] Slave I/O for channel 'group_replication_recovery': error connecting to master 'mysql_innodb_cluster_rpl_user@box01:3306' - retry-time: 60  retries: 1, Error_code: 2005
2016-09-25T00:34:11.285535Z 61 [Note] Slave I/O thread for channel 'group_replication_recovery' killed while connecting to master
2016-09-25T00:34:11.285539Z 61 [Note] Slave I/O thread exiting for channel 'group_replication_recovery', read up to log 'FIRST', position 4
2016-09-25T00:34:11.285963Z 48 [ERROR] Plugin group_replication reported: 'There was an error when connecting to the donor server. Check group replication recovery's connection credentials.'
2016-09-25T00:34:11.286204Z 48 [Note] Plugin group_replication reported: 'Retrying group recovery connection with another donor. Attempt 8/10’

While more and more errors due to connection between joiner and donor were added to the error log, I added to all boxes some entries on /etc/hosts and than, the issue was fixed. So, this is very important to consider the configuration below added to the machines’ hosts file to server as a DNS resolver. If you don’t do that, when you check the cluster.status(), it’s going to report that the joiner db node is in RECOVERY MODE as box03 or 192.168.50.13:3306 below.

1
2
3
4
5
6
7
8
9
10
11
12
13
14
15
16
17
18
19
20
21
22
23
24
25
26
27
28
29
30
31
mysql-js> cluster.status()
{
    "clusterName": "wbCluster001",
    "defaultReplicaSet": {
        "status": "Cluster is NOT tolerant to any failures.",
        "topology": {
            "192.168.50.11:3306": {
                "address": "192.168.50.11:3306",
                "status": "ONLINE",
                "role": "HA",
                "mode": "R/W",
                "leaves": {
                    "192.168.50.12:3306": {
                        "address": "192.168.50.12:3306",
                        "status": "ONLINE",
                        "role": "HA",
                        "mode": "R/O",
                        "leaves": {}
                    },
                    "192.168.50.13:3306": {
                        "address": "192.168.50.13:3306",
                        "status": "RECOVERING”,
                        "role": "HA",
                        "mode": "R/O",
                        "leaves": {}
                    }
                }
            }
        }
    }
}

As many attempts were done while I was fixing the problem related to the hosts file, I had to do a cluster.rejoinInstance for box03, as you can see below:

mysql-js> cluster.rejoinInstance('root@192.168.50.13:3306')
Please provide the password for 'root@192.168.50.13:3306':
The instance will try rejoining the InnoDB cluster. Depending on the original
problem that made the instance unavailable the rejoin, operation might not be
successful and further manual steps will be needed to fix the underlying
problem.
 
Please monitor the output of the rejoin operation and take necessary action if
the instance cannot rejoin.
Enter the password for server (root@192.168.50.13:3306):
Enter the password for replication_user (mysql_innodb_cluster_rpl_user):
Enter the password for peer_server (root@192.168.50.12:3306):
 
Running join command on '192.168.50.13@3306'.
 
Running health command on '192.168.50.13@3306'.
Group Replication members:
  - Host: box03
    Port: 3306
    State: ONLINE
  - Host: box02
    Port: 3306
    State: ONLINE
  - Host: box01
    Port: 3306
    State: ONLINE

So, at this point, the cluster is OK, all three nodes running well and fine:

1
2
3
4
5
6
7
8
9
10
11
12
13
14
15
16
17
18
19
20
21
22
23
24
25
26
27
28
29
30
31
32
33
34
35
36
37
38
39
40
41
42
43
44
45
46
47
48
49
50
51
52
53
54
55
56
57
58
59
#: describe cluster
mysql-js> cluster.describe()
{
    "clusterName": "wbCluster001",
    "adminType": "local",
    "defaultReplicaSet": {
        "name": "default",
        "instances": [
            {
                "name": "192.168.50.11:3306",
                "host": "192.168.50.11:3306",
                "role": "HA"
            },
            {
                "name": "192.168.50.12:3306",
                "host": "192.168.50.12:3306",
                "role": "HA"
            },
            {
                "name": "192.168.50.13:3306",
                "host": "192.168.50.13:3306",
                "role": "HA"
            }
        ]
    }
}
#: cluster status
 
mysql-js> cluster.status()
{
    "clusterName": "wbCluster001",
    "defaultReplicaSet": {
        "status": "Cluster is tolerant to 2 failures.",
        "topology": {
            "192.168.50.11:3306": {
                "address": "192.168.50.11:3306",
                "status": "ONLINE",
                "role": "HA",
                "mode": "R/W",
                "leaves": {
                    "192.168.50.12:3306": {
                        "address": "192.168.50.12:3306",
                        "status": "ONLINE",
                        "role": "HA",
                        "mode": "R/O",
                        "leaves": {}
                    },
                    "192.168.50.13:3306": {
                        "address": "192.168.50.13:3306",
                        "status": “ONLINE",
                        "role": "HA",
                        "mode": "R/O",
                        "leaves": {}
                    }
                }
            }
        }
    }
}

After solving the issues above mentioned, I saw the following events added to the error log on box02 and box03:

#: box02
2016-09-26T14:07:02.432632Z 0 [Note] Plugin group_replication reported: 'This server was declared online within the replication group'
 
#: box03
2016-09-26T14:14:52.432632Z 0 [Note] Plugin group_replication reported: 'This server was declared online within the replication group'

At the end, you can check that the MySQL Group Replication is the underlying feature that empower MySQL InnoDB Cluster. On box01, or, 192.168.50.11:3306:

mysql-sql> select * from performance_schema.replication_group_members;
+---------------------------+--------------------------------------+-------------+-------------+--------------+
| CHANNEL_NAME              | MEMBER_ID                            | MEMBER_HOST | MEMBER_PORT | MEMBER_STATE |
+---------------------------+--------------------------------------+-------------+-------------+--------------+
| group_replication_applier | b0b1603f-83ef-11e6-85a6-080027de0e0e | box01       |        3306 | ONLINE       |
| group_replication_applier | bb29750c-83ef-11e6-8b4f-080027de0e0e | box02       |        3306 | ONLINE       |
| group_replication_applier | bbu3761b-83ef-11e6-894c-080027de0t0e | box03       |        3306 | ONLINE       |
+---------------------------+--------------------------------------+-------------+-------------+--------------+
3 rows in set (0.00 sec)

Next time, I’m going to bootstrap the router to show some tests related to the routing connections out of failed nodes. The final considerations over this new way to provide HA to an environment using InnoDB are, there is no documentation enough yet regrading the exiting methods to manipulate instances within the cluster, in case you need to take one off, restart it or even get to know why they are OFFLINE, I haven’t found yet a way to better manipulate nodes but add them to the cluster. This is not GA, the feature was just released, to me it’s very promising and will make it easier to add clusters and I expect to see more and more about this. Once again, great job Oracle MySQL Team, let’s move on!!

You can find more resources on below links:

– http://mysqlserverteam.com/introducing-mysql-innodb-cluster-a-hands-on-tutorial/
– http://mysqlserverteam.com/introducing-mysql-innodb-cluster-mysql-ha-out-of-box-easy-to-use-high-availability/

Arrivederci!!

AddThis Social Bookmark Button

Testing the New MySQL InnoDB Cluster

setembro 20th, 2016 | by: Bianchi | Posted in: MySQL HA | No Comments »

cluster-serverAfter receiving the announcement done by Oracle via Lefred, I got myself very curious about the new MySQL InnoDB Cluster. After watching the video, I downloaded the package, got the online manual and started playing with it. My first impressions was that it has the simplicity of the MongoDB Shell, but it more resilience because it is a master-master cluster, having a node assuming the PRIMARY role when a existing one should crash. It’s really good to have something very simple like this on the MySQL World because IMHO, all we have until now requires some time to setup and have running – KISS is a very good idea and MySQL InnoDB Cluster, I see that it was created to be simple to setup, congrats for that Oracle!

After Downloading Packages…

After getting the packages on a vagrant VM, is just untar it and then, I saw that the package is made by three other main packages:

[root@box01 ~]# wget http://downloads.mysql.com/snapshots/pb/mysql-innodb-cluster-5.7.15-preview/mysql-innodb-cluster-labs201609-el7-x86_64.rpm.tar.gz
--2016-09-21 00:25:52-- http://downloads.mysql.com/snapshots/pb/mysql-innodb-cluster-5.7.15-preview/mysql-innodb-cluster-labs201609-el7-x86_64.rpm.tar.gz
Resolving downloads.mysql.com (downloads.mysql.com)... 137.254.60.14
Connecting to downloads.mysql.com (downloads.mysql.com)|137.254.60.14|:80... connected.
HTTP request sent, awaiting response... 200 OK
[root@box01 ~]# ls -lh
total 1.1G
-rw-r--r-- 1 7155 31415 490M Sep 16 10:14 mysql-5.7.15-labs-gr090-el7-x86_64.rpm-bundle.tar
-rw-r--r-- 1 root root 536M Sep 16 10:18 mysql-innodb-cluster-labs201609-el7-x86_64.rpm.tar.gz
-rw-r--r-- 1 7155 31415 4.5M Sep 16 10:14 mysql-router-2.1.0-0.1-labs-el7-x86_64.rpm-bundle.tar
-rw-r--r-- 1 7155 31415 44M Sep 16 10:14 mysql-shell-1.0.5-0.1-labs-el7-x86_64.rpm-bundle.tar

Yeah, all packages after tar zvxf has 1.1G size! It’s cool as this comprised by all 5.7 MySQL Server packages, the MySQL Router and the MySQL Shell.

[root@box01 ~]# ls -lhR
.:
total 1.1G
-rw-------. 1 root root 1.4K Jul 16 2015 anaconda-ks.cfg
-rw-r--r-- 1 7155 31415 490M Sep 16 10:14 mysql-5.7.15-labs-gr090-el7-x86_64.rpm-bundle.tar
-rw-r--r-- 1 root root 536M Sep 16 10:18 mysql-innodb-cluster-labs201609-el7-x86_64.rpm.tar.gz
-rw-r--r-- 1 7155 31415 4.5M Sep 16 10:14 mysql-router-2.1.0-0.1-labs-el7-x86_64.rpm-bundle.tar
-rw-r--r-- 1 7155 31415 44M Sep 16 10:14 mysql-shell-1.0.5-0.1-labs-el7-x86_64.rpm-bundle.tar
drwxr-xr-x 2 root root 4.0K Sep 21 01:32 rpms
 
./rpms:
total 538M
-rw-r--r-- 1 7155 31415 24M Sep 15 11:01 mysql-community-client-5.7.15-1.labs_gr090.el7.x86_64.rpm
-rw-r--r-- 1 7155 31415 272K Sep 15 11:01 mysql-community-common-5.7.15-1.labs_gr090.el7.x86_64.rpm
-rw-r--r-- 1 7155 31415 3.6M Sep 15 11:01 mysql-community-devel-5.7.15-1.labs_gr090.el7.x86_64.rpm
-rw-r--r-- 1 7155 31415 44M Sep 15 11:01 mysql-community-embedded-5.7.15-1.labs_gr090.el7.x86_64.rpm
-rw-r--r-- 1 7155 31415 23M Sep 15 11:01 mysql-community-embedded-compat-5.7.15-1.labs_gr090.el7.x86_64.rpm
-rw-r--r-- 1 7155 31415 120M Sep 15 11:01 mysql-community-embedded-devel-5.7.15-1.labs_gr090.el7.x86_64.rpm
-rw-r--r-- 1 7155 31415 2.2M Sep 15 11:02 mysql-community-libs-5.7.15-1.labs_gr090.el7.x86_64.rpm
-rw-r--r-- 1 7155 31415 2.1M Sep 15 11:02 mysql-community-libs-compat-5.7.15-1.labs_gr090.el7.x86_64.rpm
-rw-r--r-- 1 7155 31415 161M Sep 15 11:02 mysql-community-server-5.7.15-1.labs_gr090.el7.x86_64.rpm
-rw-r--r-- 1 7155 31415 112M Sep 15 11:02 mysql-community-test-5.7.15-1.labs_gr090.el7.x86_64.rpm
-rw-r--r-- 1 7155 31415 1.2M Sep 16 09:43 mysql-router-2.1.0-0.1.labs.el7.x86_64.rpm
-rw-r--r-- 1 7155 31415 3.3M Sep 16 09:43 mysql-router-debuginfo-2.1.0-0.1.labs.el7.x86_64.rpm
-rw-r--r-- 1 7155 31415 4.2M Sep 16 09:43 mysql-shell-1.0.5-0.1.labs.el7.x86_64.rpm
-rw-r--r-- 1 7155 31415 40M Sep 16 09:43 mysql-shell-debuginfo-1.0.5-0.1.labs.el7.x86_64.rpm

So, let’s get this installed, I recommend you to use yum to resolve dependencies.

[root@box01 ~]# yum -y install *.rpm
[...snip...]
Installed:
mysql-community-client.x86_64 0:5.7.15-1.labs_gr090.el7
mysql-community-common.x86_64 0:5.7.15-1.labs_gr090.el7
mysql-community-devel.x86_64 0:5.7.15-1.labs_gr090.el7
mysql-community-embedded.x86_64 0:5.7.15-1.labs_gr090.el7
mysql-community-embedded-compat.x86_64 0:5.7.15-1.labs_gr090.el7
mysql-community-embedded-devel.x86_64 0:5.7.15-1.labs_gr090.el7
mysql-community-libs.x86_64 0:5.7.15-1.labs_gr090.el7
mysql-community-libs-compat.x86_64 0:5.7.15-1.labs_gr090.el7
mysql-community-server.x86_64 0:5.7.15-1.labs_gr090.el7
mysql-community-test.x86_64 0:5.7.15-1.labs_gr090.el7
mysql-router.x86_64 0:2.1.0-0.1.labs.el7
mysql-router-debuginfo.x86_64 0:2.1.0-0.1.labs.el7
mysql-shell.x86_64 0:1.0.5-0.1.labs.el7
mysql-shell-debuginfo.x86_64 0:1.0.5-0.1.labs.el7
 
Dependency Installed:
perl-Data-Dumper.x86_64 0:2.145-3.el7
 
Replaced:
mariadb-libs.x86_64 1:5.5.41-2.el7_0

Now it’s time to start the a MySQL InnoDB Cluster! From now on, make sure you’re using a user different than root!

First step, start MySQL 5.7 and change the root password as we do for a normal MySQL instance:

[wb@box01 rpms]# systemctl start mysqld.service
[wb@box01 rpms]# cat /var/log/mysqld.log | grep temp
2016-09-20T23:45:06.950465Z 1 [Note] A temporary password is generated for root@localhost: agaUf8YrhQ!R
2016-09-20T23:45:10.198806Z 0 [Note] InnoDB: Creating shared tablespace for temporary tables
[wb@box01 rpms]# mysql -p
Enter password:
Welcome to the MySQL monitor. Commands end with ; or \g.
Your MySQL connection id is 2
Server version: 5.7.15-labs-gr090
 
Copyright (c) 2000, 2016, Oracle and/or its affiliates. All rights reserved.
 
Oracle is a registered trademark of Oracle Corporation and/or its
affiliates. Other names may be trademarks of their respective
owners.
 
Type 'help;' or '\h' for help. Type '\c' to clear the current input statement.
 
mysql&gt; alter user root@localhost identified by 'P@ssw0rd';
Query OK, 0 rows affected (0.00 sec)
 
mysql&gt; \q
Bye

At this point, if you tried to create an instance, for example on port 3310 before it has failed, the directory /root/mysql-sandboxes/3310 won’t be empty the an error will be raised if you try that again. Make sure you have that directory clean to create this instance again:

Please enter a MySQL root password for the new instance:
Deploying new MySQL instance...
ERROR: Error executing the 'sandbox create' command: The sandbox dir '/root/mysql-sandboxes/3310' is not empty.

So, having the root P@ssw0rd for MySQL 5.7 and having it running right now, let’s deploy the instances that will be added soon to our InnoDB Cluster. Below I added 5 instances:

1
2
3
4
5
6
7
8
9
10
11
12
13
14
15
16
17
18
19
20
21
22
23
24
25
26
27
28
29
30
31
32
33
34
35
36
37
38
39
40
41
42
43
44
45
46
47
48
49
mysql-js&gt; dba.deployLocalInstance(3310)
A new MySQL sandbox instance will be created on this host in
/home/wb/mysql-sandboxes/3310
 
Please enter a MySQL root password for the new instance:
Deploying new MySQL instance...
 
Instance localhost:3310 successfully deployed and started.
Use '\connect root@localhost:3310' to connect to the instance.
 
mysql-js&gt; dba.deployLocalInstance(3311)
A new MySQL sandbox instance will be created on this host in
/home/wb/mysql-sandboxes/3311
 
Please enter a MySQL root password for the new instance:
Deploying new MySQL instance...
 
Instance localhost:3311 successfully deployed and started.
Use '\connect root@localhost:3311' to connect to the instance.
 
mysql-js&gt; dba.deployLocalInstance(3312)
A new MySQL sandbox instance will be created on this host in
/home/wb/mysql-sandboxes/3312
 
Please enter a MySQL root password for the new instance:
Deploying new MySQL instance...
 
Instance localhost:3312 successfully deployed and started.
Use '\connect root@localhost:3312' to connect to the instance.
 
mysql-js&gt; dba.deployLocalInstance(3313)
A new MySQL sandbox instance will be created on this host in
/home/wb/mysql-sandboxes/3313
 
Please enter a MySQL root password for the new instance:
Deploying new MySQL instance...
 
Instance localhost:3313 successfully deployed and started.
Use '\connect root@localhost:3313' to connect to the instance.
 
mysql-js&gt; dba.deployLocalInstance(3314)
A new MySQL sandbox instance will be created on this host in
/home/wb/mysql-sandboxes/3314
 
Please enter a MySQL root password for the new instance:
Deploying new MySQL instance...
 
Instance localhost:3314 successfully deployed and started.
Use '\connect root@localhost:3314' to connect to the instance.

As the manual says, the nest step is to initialize the cluster, after connecting to on of the instances we created previously and we can choose any of the instances to use as a point to initialize the cluster:

mysql-js&gt; \connect root@localhost:3310
Creating a Session to 'root@localhost:3310'
Enter password:
Classic Session successfully established. No default schema selected.
mysql-js&gt; cluster = dba.createCluster('wbCluster001')
A new InnoDB cluster will be created on instance 'root@localhost:3310'.
 
When setting up a new InnoDB cluster it is required to define an administrative
MASTER key for the cluster. This MASTER key needs to be re-entered when making
changes to the cluster later on, e.g.adding new MySQL instances or configuring
MySQL Routers. Losing this MASTER key will require the configuration of all
InnoDB cluster entities to be changed.
 
Please specify an administrative MASTER key for the cluster 'wbCluster001':
Creating InnoDB cluster 'wbCluster001' on 'root@localhost:3310'...
Adding Seed Instance...
 
Cluster successfully created. Use Cluster.addInstance() to add MySQL instances.
At least 3 instances are needed for the cluster to be able to withstand up to
one server failure.
 
 
mysql-js&gt;

A MASTER key is required to create the cluster, make sure the value you inform as a MASTER key is well protected and you don’t lose it – it’s a important thing for the InnoDB Cluster management.

So, our MySQL InnoDB Cluster is created, Voilà!

The next step is to add the instances, now replicas, to the existing MySQL InnoDB Cluster which is wbCluster001.

1
2
3
4
5
6
7
8
9
10
11
12
13
14
15
16
17
18
19
20
21
22
23
24
25
26
27
28
29
30
31
32
33
34
35
mysql-js&gt; cluster.addInstance('root@localhost:3311')
A new instance will be added to the InnoDB cluster. Depending on the amount of
data on the cluster this might take from a few seconds to several hours.
 
Please provide the password for 'root@localhost:3311':
Adding instance to the cluster ...
 
The instance 'root@localhost:3311' was successfully added to the cluster.
 
mysql-js&gt; cluster.addInstance('root@localhost:3312')
A new instance will be added to the InnoDB cluster. Depending on the amount of
data on the cluster this might take from a few seconds to several hours.
 
Please provide the password for 'root@localhost:3312':
Adding instance to the cluster ...
 
The instance 'root@localhost:3312' was successfully added to the cluster.
 
mysql-js&gt; cluster.addInstance('root@localhost:3313')
A new instance will be added to the InnoDB cluster. Depending on the amount of
data on the cluster this might take from a few seconds to several hours.
 
Please provide the password for 'root@localhost:3313':
Adding instance to the cluster ...
 
The instance 'root@localhost:3313' was successfully added to the cluster.
 
mysql-js&gt; cluster.addInstance('root@localhost:3314')
A new instance will be added to the InnoDB cluster. Depending on the amount of
data on the cluster this might take from a few seconds to several hours.
 
Please provide the password for 'root@localhost:3314':
Adding instance to the cluster ...
 
The instance 'root@localhost:3314' was successfully added to the cluster.

Finally, we can check the whole cluster:

1
2
3
4
5
6
7
8
9
10
11
12
13
14
15
16
17
18
19
20
21
22
23
24
25
26
27
28
29
30
31
32
33
34
35
36
37
38
39
40
41
42
43
44
45
mysql-js&gt; cluster.status()
{
    "clusterName": "wbCluster001",
    "defaultReplicaSet": {
        "status": "Cluster tolerant to up to 3 failures.",
        "topology": {
            "localhost:3310": {
                "address": "localhost:3310",
                "status": "ONLINE",
                "role": "HA",
                "mode": "R/W",
                "leaves": {
                    "localhost:3311": {
                        "address": "localhost:3311",
                        "status": "ONLINE",
                        "role": "HA",
                        "mode": "R/O",
                        "leaves": {}
                    },
                    "localhost:3312": {
                        "address": "localhost:3312",
                        "status": "ONLINE",
                        "role": "HA",
                        "mode": "R/O",
                        "leaves": {}
                    },
                    "localhost:3313": {
                        "address": "localhost:3313",
                        "status": "ONLINE",
                        "role": "HA",
                        "mode": "R/O",
                        "leaves": {}
                    },
                    "localhost:3314": {
                        "address": "localhost:3314",
                        "status": "ONLINE",
                        "role": "HA",
                        "mode": "R/O",
                        "leaves": {}
                    }
                }
            }
        }
    }
}

Beautiful!! All nodes reporting the status ONLINE when it could be reporting OFFLINE or RECOVERING when it’s receiving updates, catching up with the cluster’s state, as when we add a new node to an existing cluster. Additionally, just the bootstrapped node is in R/W mode at this point and the others are in R/O. That means that the solutions was designed to support writes in one node, that is considered as PRIMARY and the others are considered SECONDARIES. When the current primary goes down, one of the secondaries will assume the role.

At this point we can check another things regrading the MySQL InnoDB Cluster.

#: local instances metadata
[wb@box01 ~]$ ls -lh ~/mysql-sandboxes/
insgesamt 24K
drwxrwxr-x 4 wb wb 4,0K 22. Sep 01:00 3310
drwxrwxr-x 4 wb wb 4,0K 22. Sep 01:02 3311
drwxrwxr-x 4 wb wb 4,0K 22. Sep 01:02 3312
drwxrwxr-x 4 wb wb 4,0K 22. Sep 01:02 3313
drwxrwxr-x 4 wb wb 4,0K 22. Sep 01:03 3314
drwxrwxr-x 4 wb wb 4,0K 22. Sep 01:03 3315
 
#: sockets open
[wb@box01 ~]$ netstat -na | grep sand
unix  2      [ ACC ]     STREAM     HÖRT         25608    /home/wb/mysql-sandboxes/3315/mysqlx.sock
unix  2      [ ACC ]     STREAM     HÖRT         25613    /home/wb/mysql-sandboxes/3315/mysqld.sock
unix  2      [ ACC ]     STREAM     HÖRT         25386    /home/wb/mysql-sandboxes/3313/mysqlx.sock
unix  2      [ ACC ]     STREAM     HÖRT         25391    /home/wb/mysql-sandboxes/3313/mysqld.sock
unix  2      [ ACC ]     STREAM     HÖRT         25275    /home/wb/mysql-sandboxes/3312/mysqlx.sock
unix  2      [ ACC ]     STREAM     HÖRT         25280    /home/wb/mysql-sandboxes/3312/mysqld.sock
unix  2      [ ACC ]     STREAM     HÖRT         24903    /home/wb/mysql-sandboxes/3310/mysqlx.sock
unix  2      [ ACC ]     STREAM     HÖRT         24908    /home/wb/mysql-sandboxes/3310/mysqld.sock
unix  2      [ ACC ]     STREAM     HÖRT         25166    /home/wb/mysql-sandboxes/3311/mysqlx.sock
unix  2      [ ACC ]     STREAM     HÖRT         25171    /home/wb/mysql-sandboxes/3311/mysqld.sock
unix  2      [ ACC ]     STREAM     HÖRT         25497    /home/wb/mysql-sandboxes/3314/mysqlx.sock
unix  2      [ ACC ]     STREAM     HÖRT         25502    /home/wb/mysql-sandboxes/3314/mysqld.sock

If you disconnected from mysqlsh and would like to get back connected with your created cluster, you need to access the instance you used to create the seed and then use the dba.getCluster() in order to set a variable with the name of the cluster you want to check and then, use the cluster.status again, as below:

mysql-js> \connect root@localhost:3310
Creating a Session to 'root@localhost:3310'
Enter password:
Classic Session successfully established. No default schema selected.
mysql-js> cluster = dba.getCluster()
When the InnoDB cluster was setup, a MASTER key was defined in order to enable
performing administrative tasks on the cluster.
 
Please specify the administrative MASTER key for the default cluster:
<Cluster:wbCluster001>

And the cluster.status()

1
2
3
4
5
6
7
8
9
10
11
12
13
14
15
16
17
18
19
20
21
22
23
24
25
26
27
28
29
30
31
32
33
34
35
36
37
38
39
40
41
42
43
44
45
46
47
48
49
50
51
52
53
54
mysql-js> cluster.status()
{
    "clusterName": "wbCluster001",
    "defaultReplicaSet": {
        "status": "Cluster tolerant to up to 4 failures.",
        "topology": {
            "localhost:3310": {
                "address": "localhost:3310",
                "status": "ONLINE",
                "role": "HA",
                "mode": "R/W",
                "leaves": {
                    "localhost:3311": {
                        "address": "localhost:3311",
                        "status": "ONLINE",
                        "role": "HA",
                        "mode": "R/O",
                        "leaves": {}
                    },
                    "localhost:3312": {
                        "address": "localhost:3312",
                        "status": "ONLINE",
                        "role": "HA",
                        "mode": "R/O",
                        "leaves": {}
                    },
                    "localhost:3313": {
                        "address": "localhost:3313",
                        "status": "ONLINE",
                        "role": "HA",
                        "mode": "R/O",
                        "leaves": {}
                    },
                    "localhost:3314": {
                        "address": "localhost:3314",
                        "status": "ONLINE",
                        "role": "HA",
                        "mode": "R/O",
                        "leaves": {}
                    },
                    "localhost:3315": {
                        "address": "localhost:3315",
                        "status": "ONLINE",
                        "role": "HA",
                        "mode": "R/O",
                        "leaves": {}
                    }
                }
            }
        }
    }
}
mysql-js> \q
Bye!

More resources:

  • Docs: https://dev.mysql.com/doc/mysql-innodb-cluster/en/

AddThis Social Bookmark Button

MySQL 8.0 DMR, new features, part 1

setembro 12th, 2016 | by: Bianchi | Posted in: MySQL Tuning | No Comments »

I would like to start this telling the reader that this is going to be the first of some blog posts I’m planning to exploit subjects around MySQL 8.0, as I have been testing its features. As I’m an Oracle ACE Director, part of the Oracle ACEs program, I received from my friend Fred Deschamps, currently the Oracle community Manager for MySQL, the early access to the binary as well as a briefing of the new features, changes and deprecations. I would like to say that I’ve got pretty excited with many of the coming features and changes for existing features available on 5.6/5.7 and I’m going to write more about some of the hot topics published here by Oracle MySQL 8.0. Just for the records and just in case you get curious, the operating system I’m using for this and other blog posts related to MySQL 8.0 is CentOS 7 with Kernel 3.10.0-229.el7.x86_64.

Current status of mysql.service:

[root@mysql80drm1 vagrant]# systemctl status mysqld.service
● mysqld.service - MySQL Server
Loaded: loaded (/usr/lib/systemd/system/mysqld.service; enabled; vendor preset: disabled)
Active: active (running) since Sun 2016-08-28 01:51:51 CEST; 2s ago
Process: 16304 ExecStart=/usr/sbin/mysqld --daemonize --pid-file=/var/run/mysqld/mysqld.pid $MYSQLD_OPTS (code=exited, status=0/SUCCESS)
Process: 16229 ExecStartPre=/usr/bin/mysqld_pre_systemd (code=exited, status=0/SUCCESS)
Main PID: 16307 (mysqld)
CGroup: /system.slice/mysqld.service
└─16307 /usr/sbin/mysqld --daemonize --pid-file=/var/run/mysqld/mysqld.pid

Aug 28 01:51:46 mysql80drm1 systemd[1]: Starting MySQL Server...
Aug 28 01:51:51 mysql80drm1 systemd[1]: Started MySQL Server.

As expected behavior since MySQL 5.7.6, the initial root account temporary password is generated on error log and must be changed on the first access as that temporary password is set as expired. Due to password validation plugin be enabled by default, you need to chose a good password to be able to change the root account one. Mine is P@ssw0rd to streamline it at this point.

[root@mysql80drm1 vagrant]# cat /var/log/mysqld.log | egrep "A temporary password is generated for root@localhost"
2016-08-27T23:51:47.582177Z 4 [Note] A temporary password is generated for root@localhost: aLpaL<?3p>T=

[root@mysql80drm1 vagrant]# mysql -u root -p
Enter password:
Welcome to the MySQL monitor. Commands end with ; or \g.
Your MySQL connection id is 5
Server version: 8.0.0-dmr

Copyright (c) 2000, 2016, Oracle and/or its affiliates. All rights reserved.
Oracle is a registered trademark of Oracle Corporation and/or its
 affiliates. Other names may be trademarks of their respective
 owners.
Type 'help;' or '\h' for help. Type '\c' to clear the current input statement.
mysql> ALTER USER root@localhost IDENTIFIED BY 'P@ssw0rd';
 Query OK, 0 rows affected (0.00 sec)
mysql> \q
 Bye

MySQL 8.0 DMR 1 – Transaction Data Dictionary

When I started reading the document shared by Oracle for ACE regarding the coming changes for MySQL 8.0, I need to re-read it to really believe that the old I_S has gone. Additionally, all those files containing metadata persisted on disk do not exists anymore, so, “the FRM, TRG, PAR files are gone”.

mysql> create database wb;
 Query OK, 1 row affected (0.00 sec)
mysql> use wb;
 Database changed
mysql> \! ls -lh /var/lib/mysql/wb
 total 144K
 -rw-r----- 1 mysql mysql 144K Sep 11 02:07 t1.ibd

This a very good step for the product as we can now use I_S tables as the queries go to the same execution path as normal queries and not gather all the needed data on the query time or generate lots of disk seeks to responde to a query. Many blogs were written along the time since the mysql’s data dictionary appeared (http://www.technocation.org/content/how-tell-when-using-informationschema-might-crash-your-database-0).

The case is that, the current implementation of I_S is not useful when dealing with big instances, having lots of objects. As more objects you have in a mysql instance, as more risky become the queries against the data dictionary and this is one of the benefits I can see at this moment, as, when having I_S as Views, it’s going to improve the speed and make it stable when querying tables. Yet, about the new Data Dictionary, it’s good to have a transactional control, where reads completes independent of writes going on like DDL statements altering columns, for example. More information about this, http://mysqlserverteam.com/a-new-data-dictionary-for-mysql/. Morgan has written about the FRM files going away some time ago, http://www.tocker.ca/2014/07/30/beyond-the-frm-ideas-for-a-native-mysql-data-dictionary.html

If we compare the number of tables contained on the INFORMATION_SCHEMA between MySQL 5.7 and the 8.0, the latter has currently 6 additional tables. These tables on the new version will become VIEWS from the underlying tables that stores data in a dedicated dictionary tablespace and queries requesting metadata will go through the same process as any other regular query. Below we can see the New MySQL Data Dictionary architecture:

New Data Dictionary

Current DMR documentation compares what’;s avaulable on 5.7 and what’s coming with the New Data Dictionary on 8.0. Basically, 5.7 has all the .frm files for tables yet on disk in a persistent way. what was said to be an approximation of a data dictionary, but not yet centralized in one place. MySQL 8.0 has an explicit definition of what the data dictionary is and is not, namely an identified set of metadata tables stored in transactional storage (InnoDB). Some additional features can come soon regarding the names of the files as the engineers are thinking to use some internal identifiers to the file names, which will impact on the usage of a filename-safe encoding introduced on MySQL 5.1 which means that the “table name” that the storage engine gets is not the original table name, it is converted to be a safe filename. All the “troublesome” characters are encoded. You can check more about the assumptions about the schema definitions names clicking here, WL#6379. Yet on the same link, once can see the new tables’ definition.

We can think that, when one need to alter a column data type or even rebuild a table, data dictionary should be  accessible for reads and writes at the same time that other users are running some online schema changes. And this is the name of the new feature, Transactional Data Dictionary. I_S queries will run and be executed under different isolation level set by the user.

At the end, this is of a big benefit for DBAs that uses I_S as target of many scripts, having it as an impossible strategy due to the big number of objects on existing databases. I use to work daily with some customers that it’s prohibited to query I_S during business hours as it can crash the instance. I’m very happy to get this feature on MySQL 8.0 where I_S is now VIEWs of metadata tables and temporary tables and and preparation of TABLE_SHARE object upon every query execution; we know very well what is that, the scan of many files on disk to gather all the needed data to deliver result to the requester.

MySQL 8.0 DMR 1 – Invisible Indexes

One of the features that will add a good strategy to the sauce when you think about design review, focusing queries and table’s indexes is the Invisible Indexes, as a index can be marked as Visible or Invisible, being considered or not by the optimizer on query’s execution. As said on the DMR 1 docs, it should be a good topic to be considered when making a query more efficient. Below you can see things in action, considering the comments  for each row:

mysql> show tables;
+--------------+
| Tables_in_wb |
+--------------+
| t1 |
+--------------+
1 row in set (0.00 sec)
mysql> show create table t1;
+-------+----------------------------------------------------------+
| Table | Create Table |
+-------+----------------------------------------------------------+
| t1 | CREATE TABLE `t1` (
 `i` int(11) DEFAULT NULL,
 KEY `i` (`i`)
) ENGINE=InnoDB DEFAULT CHARSET=latin1 |
+-------+----------------------------------------------------------+
1 row in set (0.00 sec)
mysql> explain select i from t1 use index(i)\G
*************************** 1. row ***************************
 id: 1
 select_type: SIMPLE
 table: t1
 partitions: NULL
 type: index
possible_keys: NULL
 key: i
 key_len: 5
 ref: NULL
 rows: 1
 filtered: 100.00
 Extra: Using index
1 row in set, 1 warning (0.00 sec)
mysql> show index from t1\G
*************************** 1. row ***************************
 Table: t1
 Non_unique: 1
 Key_name: i
 Seq_in_index: 1
 Column_name: i
 Collation: A
 Cardinality: NULL
 Sub_part: NULL
 Packed: NULL
 Null: YES
 Index_type: BTREE
 Comment:
Index_comment:
 Visible: YES
1 row in set (0.01 sec)

We can make the above index invisible:

mysql> alter table t1 alter index i invisible;
Query OK, 0 rows affected (0.02 sec)
Records: 0 Duplicates: 0 Warnings: 0
mysql> show index from t1\G
*************************** 1. row ***************************
 Table: t1
 Non_unique: 1
 Key_name: i
 Seq_in_index: 1
 Column_name: i
 Collation: A
 Cardinality: NULL
 Sub_part: NULL
 Packed: NULL
 Null: YES
 Index_type: BTREE
 Comment:
Index_comment:
 Visible: NO
1 row in set (0.01 sec)

mysql> explain select i from t1 use index(i)\G
*************************** 1. row ***************************
 id: 1
 select_type: SIMPLE
 table: t1
 partitions: NULL
 type: ALL
possible_keys: NULL
 key: NULL
 key_len: NULL
 ref: NULL
 rows: 1
 filtered: 100.00
 Extra: NULL
1 row in set, 1 warning (0.00 sec)

Here, with this feature, you don’t need to remove an index to test queries, in case you think an index is a duplicate one as you can just make it visible or invisible.

MySQL 8.0 DMR 1 – MySQL System Database now in InnoDB

This work has started with MySQL 5.7 and now, they announced that this is completed. It was one of the most expected things on MySQL to make it full transactional and say a bye-bye to MyISAM. All the tables as below are in InnoDB, with the exception of the general and slow logs, that could impact server, writing too much data.

mysql> SELECT TABLE_SCHEMA,TABLE_NAME,ENGINE 
       FROM INFORMATION_SCHEMA.TABLES 
       WHERE TABLE_SCHEMA='mysql'\G
*************************** 1. row ***************************
TABLE_SCHEMA: mysql
 TABLE_NAME: column_stats
 ENGINE: InnoDB
*************************** 2. row ***************************
TABLE_SCHEMA: mysql
 TABLE_NAME: columns_priv
 ENGINE: InnoDB
*************************** 3. row ***************************
TABLE_SCHEMA: mysql
 TABLE_NAME: component
 ENGINE: InnoDB
*************************** 4. row ***************************
TABLE_SCHEMA: mysql
 TABLE_NAME: db
 ENGINE: InnoDB
*************************** 5. row ***************************
TABLE_SCHEMA: mysql
 TABLE_NAME: default_roles
 ENGINE: InnoDB
*************************** 6. row ***************************
TABLE_SCHEMA: mysql
 TABLE_NAME: engine_cost
 ENGINE: InnoDB
*************************** 7. row ***************************
TABLE_SCHEMA: mysql
 TABLE_NAME: func
 ENGINE: InnoDB
*************************** 8. row ***************************
TABLE_SCHEMA: mysql
 TABLE_NAME: general_log
 ENGINE: CSV
*************************** 9. row ***************************
TABLE_SCHEMA: mysql
 TABLE_NAME: gtid_executed
 ENGINE: InnoDB
*************************** 10. row ***************************
TABLE_SCHEMA: mysql
 TABLE_NAME: help_category
 ENGINE: InnoDB
*************************** 11. row ***************************
TABLE_SCHEMA: mysql
 TABLE_NAME: help_keyword
 ENGINE: InnoDB
*************************** 12. row ***************************
TABLE_SCHEMA: mysql
 TABLE_NAME: help_relation
 ENGINE: InnoDB
*************************** 13. row ***************************
TABLE_SCHEMA: mysql
 TABLE_NAME: help_topic
 ENGINE: InnoDB
*************************** 14. row ***************************
TABLE_SCHEMA: mysql
 TABLE_NAME: innodb_index_stats
 ENGINE: InnoDB
*************************** 15. row ***************************
TABLE_SCHEMA: mysql
 TABLE_NAME: innodb_table_stats
 ENGINE: InnoDB
*************************** 16. row ***************************
TABLE_SCHEMA: mysql
 TABLE_NAME: plugin
 ENGINE: InnoDB
*************************** 17. row ***************************
TABLE_SCHEMA: mysql
 TABLE_NAME: procs_priv
 ENGINE: InnoDB
*************************** 18. row ***************************
TABLE_SCHEMA: mysql
 TABLE_NAME: proxies_priv
 ENGINE: InnoDB
*************************** 19. row ***************************
TABLE_SCHEMA: mysql
 TABLE_NAME: role_edges
 ENGINE: InnoDB
*************************** 20. row ***************************
TABLE_SCHEMA: mysql
 TABLE_NAME: server_cost
 ENGINE: InnoDB
*************************** 21. row ***************************
TABLE_SCHEMA: mysql
 TABLE_NAME: servers
 ENGINE: InnoDB
*************************** 22. row ***************************
TABLE_SCHEMA: mysql
 TABLE_NAME: slave_master_info
 ENGINE: InnoDB
*************************** 23. row ***************************
TABLE_SCHEMA: mysql
 TABLE_NAME: slave_relay_log_info
 ENGINE: InnoDB
*************************** 24. row ***************************
TABLE_SCHEMA: mysql
 TABLE_NAME: slave_worker_info
 ENGINE: InnoDB
*************************** 25. row ***************************
TABLE_SCHEMA: mysql
 TABLE_NAME: slow_log
 ENGINE: CSV
*************************** 26. row ***************************
TABLE_SCHEMA: mysql
 TABLE_NAME: tables_priv
 ENGINE: InnoDB
*************************** 27. row ***************************
TABLE_SCHEMA: mysql
 TABLE_NAME: time_zone
 ENGINE: InnoDB
*************************** 28. row ***************************
TABLE_SCHEMA: mysql
 TABLE_NAME: time_zone_leap_second
 ENGINE: InnoDB
*************************** 29. row ***************************
TABLE_SCHEMA: mysql
 TABLE_NAME: time_zone_name
 ENGINE: InnoDB
*************************** 30. row ***************************
TABLE_SCHEMA: mysql
 TABLE_NAME: time_zone_transition
 ENGINE: InnoDB
*************************** 31. row ***************************
TABLE_SCHEMA: mysql
 TABLE_NAME: time_zone_transition_type
 ENGINE: InnoDB
*************************** 32. row ***************************
TABLE_SCHEMA: mysql
 TABLE_NAME: user
 ENGINE: InnoDB
32 rows in set (0,00 sec)

So, here, I presented three topics with reference of the new features coming with the new MySQL 8.0 DMR 1. I’m working on another post that will be released here within the coming days to show more new about that.

AddThis Social Bookmark Button

MariaDB 10.1, MSR and MTS

março 24th, 2016 | by: Bianchi | Posted in: MySQL Manutenção, MySQL Replication | No Comments »

As a preparation of my presentation together with Max Bubenick at 2016’s Percona Live, happening in Santa Clara, CA, US, I’m running as many tests as I can to check all the maturity of the technology of feature we are about to talking about. This is a common sense that you need to go over the planned to be presented feature in order to address some of the implicit subjects. This way, we stared discussing about a crash on MariaDB 10.1 setup for a Multi-Source Replication Slave, being this slave server a Multi-Threaded Slave as well running with 12 threads dedicated to execute raw updates from the relay log, having at least 3 out of those 12 threads dedicated to each of the exiting domain_id. You can check the numbers of threads dedicated to each domain_id interpreting the contents of mysql.gtid_slave_pos table to keep track of their current position (the global transaction ID of the last transaction applied). Using the table allows the slave to maintain a consistent value for the gtid_slave_pos system variable across server restarts. That is, as a I have setup 3 masters and one multi-source slave, in this scenario I’ve got domains #2, #3, #4, being the multi-source slave the domain #1. That justifies the 12 threads and at least 3 for each domain.

Below, the designed architecture:

Screen Shot 2016-03-24 at 9.23.40 AM

box01 - @@server_id=1, @@gtid_domain_id=1
box02 - @@server_id=2, @@gtid_domain_id=2
box03 - @@server_id=3, @@gtid_domain_id=3
box04 - @@server_id=4, @@gtid_domain_id=4

After configuring the multi-source replication and having configuration files well set, I started some tests.

#: Connection name with box02
MariaDB [(none)]> change master 'box02' to master_host='192.168.0.102', master_user='repl', master_password='Bi@nchI', master_use_gtid=current_pos;
#: Connection name with box03
MariaDB [(none)]> change master 'box03' to master_host='192.168.0.102', master_user='repl', master_password='Bi@nchI', master_use_gtid=current_pos;
#: Connection name with box04
MariaDB [(none)]> change master 'box04' to master_host='192.168.0.104', master_user='repl', master_password='Bi@nchI', master_use_gtid=current_pos;

Just to make sure we’re on the same page, I created on the master’s side individual databases to make the masters to write just to their own database schema to avoid conflicts on writing to the same table (that’s an existing successful case I have to formulate a new blog to tell). So, after that, I used sysbench to prepare the test case, creating 10 tables in each database schema with 10000 rows each table. Finally, I run sysbench with the following structure to execute a simple 60 secs test using OLTP script:

[vagrant@maria0X ~]$ sudo sysbench --test=/usr/share/doc/sysbench/tests/db/oltp.lua --oltp-table-size=10000 --mysql-db=box0X --oltp-tables-count=10 --mysql-user=root --db-driver=mysql --mysql-table-engine=innodb --max-time=60 --max-requests=0 --report-interval=60 --num-threads=50 --mysql-engine-trx=yes run

I started the above sysbench on all the three masters and then, the multi-source slave has crashed with the below error:

2016-03-23 19:54:57 140604957547264 [ERROR] Slave (additional info): Commit failed due to failure of an earlier commit on which this one depends Error_code: 1964
2016-03-23 19:54:57 140604957547264 [Warning] Slave: Running in read-only mode Error_code: 1836
2016-03-23 19:54:57 140604957547264 [Warning] Slave: Table 'sbtest2' is read only Error_code: 1036
2016-03-23 19:54:57 140604957547264 [Warning] Slave: Commit failed due to failure of an earlier commit on which this one depends Error_code: 1964
[...snip...]
2016-03-23 19:54:57 140604957244160 [ERROR] Slave (additional info): Commit failed due to failure of an earlier commit on which this one depends Error_code: 1964
2016-03-23 19:54:57 140604957244160 [Warning] Slave: Running in read-only mode Error_code: 1836
2016-03-23 19:54:57 140604957244160 [Warning] Slave: Table 'sbtest1' is read only Error_code: 1036
2016-03-23 19:54:57 140604957244160 [Warning] Slave: Commit failed due to failure of an earlier commit on which this one depends Error_code: 1964
[...snip...]
2016-03-23 19:59:14 140604959972096 [Note] /usr/sbin/mysqld: Normal shutdown

The problem here is clear, “Commit failed due to failure of an earlier commit on which this one depends”.

Furthermore, when I tried to start multi-source slave back, I found the following events added to the error log:

2016-03-23 19:59:17 139987887904800 [Note] /usr/sbin/mysqld (mysqld 10.1.11-MariaDB-log) starting as process 3996 ...
2016-03-23 19:59:17 139987887904800 [Note] InnoDB: Using mutexes to ref count buffer pool pages
2016-03-23 19:59:17 139987887904800 [Note] InnoDB: The InnoDB memory heap is disabled
2016-03-23 19:59:17 139987887904800 [Note] InnoDB: Mutexes and rw_locks use GCC atomic builtins
2016-03-23 19:59:17 139987887904800 [Note] InnoDB: Memory barrier is not used
2016-03-23 19:59:17 139987887904800 [Note] InnoDB: Compressed tables use zlib 1.2.3
2016-03-23 19:59:17 139987887904800 [Note] InnoDB: Using Linux native AIO
2016-03-23 19:59:17 139987887904800 [Note] InnoDB: Using generic crc32 instructions
2016-03-23 19:59:17 139987887904800 [Note] InnoDB: Initializing buffer pool, size = 128.0M
2016-03-23 19:59:17 139987887904800 [Note] InnoDB: Completed initialization of buffer pool
2016-03-23 19:59:17 139987887904800 [Note] InnoDB: Highest supported file format is Barracuda.
InnoDB: Transaction 46834 was in the XA prepared state.
InnoDB: Transaction 46835 was in the XA prepared state.
InnoDB: Transaction 46836 was in the XA prepared state.
InnoDB: Transaction 46838 was in the XA prepared state.
InnoDB: Transaction 46839 was in the XA prepared state.
InnoDB: 6 transaction(s) which must be rolled back or cleaned up
InnoDB: in total 4 row operations to undo
InnoDB: Trx id counter is 47616
2016-03-23 19:59:17 139987887904800 [Note] InnoDB: 128 rollback segment(s) are active.
2016-03-23 19:59:17 139987887904800 [Note] InnoDB: Waiting for purge to start
InnoDB: Starting in background the rollback of uncommitted transactions
2016-03-23 19:59:17 7f51503fe700 InnoDB: Rolling back trx with id 46837, 4 rows to undo
2016-03-23 19:59:17 139987215443712 [Note] InnoDB: Rollback of trx with id 46837 completed
2016-03-23 19:59:17 7f51503fe700 InnoDB: Rollback of non-prepared transactions completed
2016-03-23 19:59:17 139987887904800 [Note] InnoDB: Percona XtraDB (http://www.percona.com) 5.6.26-76.0 started; log sequence number 124266988
2016-03-23 19:59:17 139987887904800 [Note] Plugin 'FEEDBACK' is disabled.
2016-03-23 19:59:17 7f517854d820 InnoDB: Starting recovery for XA transactions...
2016-03-23 19:59:17 7f517854d820 InnoDB: Transaction 46839 in prepared state after recovery
2016-03-23 19:59:17 7f517854d820 InnoDB: Transaction contains changes to 7 rows
2016-03-23 19:59:17 7f517854d820 InnoDB: Transaction 46838 in prepared state after recovery
2016-03-23 19:59:17 7f517854d820 InnoDB: Transaction contains changes to 5 rows
2016-03-23 19:59:17 7f517854d820 InnoDB: Transaction 46836 in prepared state after recovery
2016-03-23 19:59:17 7f517854d820 InnoDB: Transaction contains changes to 7 rows
2016-03-23 19:59:17 7f517854d820 InnoDB: Transaction 46835 in prepared state after recovery
2016-03-23 19:59:17 7f517854d820 InnoDB: Transaction contains changes to 5 rows
2016-03-23 19:59:17 7f517854d820 InnoDB: Transaction 46834 in prepared state after recovery
2016-03-23 19:59:17 7f517854d820 InnoDB: Transaction contains changes to 7 rows
2016-03-23 19:59:17 7f517854d820 InnoDB: 5 transactions in prepared state after recovery
2016-03-23 19:59:17 139987887904800 [Note] Found 5 prepared transaction(s) in InnoDB
2016-03-23 19:59:17 139987887904800 [ERROR] Found 5 prepared transactions! It means that mysqld was not shut down properly last time and critical recovery information (last binlog or tc.log file) was manually deleted after a crash. You have to start mysqld with --tc-heuristic-recover switch to commit or rollback pending transactions.
2016-03-23 19:59:17 139987887904800 [ERROR] Aborting

So, to get the MSR Slave back:

[vagrant@maria01 ~]$ sudo mysqld --defaults-file=/etc/my.cnf --tc-heuristic-recover=ROLLBACK
2016-03-23 20:18:20 140348206848032 [Note] mysqld (mysqld 10.1.11-MariaDB-log) starting as process 4047 ...
2016-03-23 20:18:21 140348206848032 [Note] InnoDB: Using mutexes to ref count buffer pool pages
2016-03-23 20:18:21 140348206848032 [Note] InnoDB: The InnoDB memory heap is disabled
2016-03-23 20:18:21 140348206848032 [Note] InnoDB: Mutexes and rw_locks use GCC atomic builtins
2016-03-23 20:18:21 140348206848032 [Note] InnoDB: Memory barrier is not used
2016-03-23 20:18:21 140348206848032 [Note] InnoDB: Compressed tables use zlib 1.2.3
2016-03-23 20:18:21 140348206848032 [Note] InnoDB: Using Linux native AIO
2016-03-23 20:18:21 140348206848032 [Note] InnoDB: Using generic crc32 instructions
2016-03-23 20:18:21 140348206848032 [Note] InnoDB: Initializing buffer pool, size = 128.0M
2016-03-23 20:18:21 140348206848032 [Note] InnoDB: Completed initialization of buffer pool
2016-03-23 20:18:21 140348206848032 [Note] InnoDB: Highest supported file format is Barracuda.
InnoDB: Transaction 46834 was in the XA prepared state.
InnoDB: Transaction 46835 was in the XA prepared state.
InnoDB: Transaction 46836 was in the XA prepared state.
InnoDB: Transaction 46838 was in the XA prepared state.
InnoDB: Transaction 46839 was in the XA prepared state.
InnoDB: 5 transaction(s) which must be rolled back or cleaned up
InnoDB: in total 0 row operations to undo
InnoDB: Trx id counter is 48128
2016-03-23 20:18:21 140348206848032 [Note] InnoDB: 128 rollback segment(s) are active.
2016-03-23 20:18:21 140348206848032 [Note] InnoDB: Waiting for purge to start
InnoDB: Starting in background the rollback of uncommitted transactions
2016-03-23 20:18:21 7fa534bff700 InnoDB: Rollback of non-prepared transactions completed
2016-03-23 20:18:21 140348206848032 [Note] InnoDB: Percona XtraDB (http://www.percona.com) 5.6.26-76.0 started; log sequence number 124267433
2016-03-23 20:18:21 140348206848032 [Note] Plugin 'FEEDBACK' is disabled.
2016-03-23 20:18:21 140348206848032 [Note] Heuristic crash recovery mode
2016-03-23 20:18:21 7fa55d039820 InnoDB: Starting recovery for XA transactions...
2016-03-23 20:18:21 7fa55d039820 InnoDB: Transaction 46839 in prepared state after recovery
2016-03-23 20:18:21 7fa55d039820 InnoDB: Transaction contains changes to 7 rows
2016-03-23 20:18:21 7fa55d039820 InnoDB: Transaction 46838 in prepared state after recovery
2016-03-23 20:18:21 7fa55d039820 InnoDB: Transaction contains changes to 5 rows
2016-03-23 20:18:21 7fa55d039820 InnoDB: Transaction 46836 in prepared state after recovery
2016-03-23 20:18:21 7fa55d039820 InnoDB: Transaction contains changes to 7 rows
2016-03-23 20:18:21 7fa55d039820 InnoDB: Transaction 46835 in prepared state after recovery
2016-03-23 20:18:21 7fa55d039820 InnoDB: Transaction contains changes to 5 rows
2016-03-23 20:18:21 7fa55d039820 InnoDB: Transaction 46834 in prepared state after recovery
2016-03-23 20:18:21 7fa55d039820 InnoDB: Transaction contains changes to 7 rows
2016-03-23 20:18:21 7fa55d039820 InnoDB: 5 transactions in prepared state after recovery
2016-03-23 20:18:21 140348206848032 [Note] Found 5 prepared transaction(s) in InnoDB
2016-03-23 20:18:21 140347457898240 [Note] InnoDB: Dumping buffer pool(s) not yet started
2016-03-23 20:18:21 140348206848032 [Note] Please restart mysqld without --tc-heuristic-recover
2016-03-23 20:18:21 140348206848032 [ERROR] Can't init tc log
2016-03-23 20:18:21 140348206848032 [ERROR] Aborting

And finally:

[vagrant@maria01 ~]$ sudo service mysql start
Starting MySQL... SUCCESS!

By the way, as per the discussion on twitter, I’m not really sure yet if this is a problem related to the in-order commit when using parallel replication which implies that a transaction commit conflict is happening at that point. Below the configuration file used for the MSR Slave, showing that it’s configured with @@slave_pararllel_mode=optimistic which as per the manual online “tries to apply most transactional DML in parallel, and handles any conflicts with rollback and retry”, more info here.

#: box01 - multi-source slave
[client]
port=3306
socket=/var/lib/mysql/mysql.sock
[mysqld]
user=mysql
port=3306
socket=/var/lib/mysql/mysql.sock
basedir=/usr
datadir=/var/lib/mysql
read_only=1
#: repl vars
server_id=1
report_host=box01
report_port=3306
report_user=repl
log_bin=mysql-bin
log_bin_index=mysql.index
log_slave_updates=true
binlog_format=ROW
#: verify checksum on master
master_verify_checksum=1
#: gtid vars
gtid_domain_id=1
gtid_ignore_duplicates=ON
gtid_strict_mode=1
 
#: msr slave parallel mode *
box02.slave_parallel_mode=conservative
box03.slave_parallel_mode=conservative
box04.slave_parallel_mode=conservative
 
slave_parallel_threads=10
slave_domain_parallel_threads=2
slave_parallel_max_queued=512M
slave_net_timeout=15
slave_sql_verify_checksum=1
slave_compressed_protocol=1
#: binary log group commit behavior
#binlog_commit_wait_usec=100000
#binlog_commit_wait_count=20

Maybe a test using @@slave_domain_parallel_threads should be done as the next step, but, if you have any additional thoughts on this, it’s really appreciated.

Continuing with this, I found that Connection Names were not running in optimistic mode (it was conservative, which limits parallelism in an effort to avoid any conflicts) and then after changing that, I did the test again:

#: current values
MariaDB [(none)]> show all slaves status\G
              Connection_name: box02
                Parallel_Mode: conservative
              Connection_name: box03
                Parallel_Mode: conservative
              Connection_name: box04
                Parallel_Mode: conservative
3 rows in set (0.00 sec)
 
#: changing Parallel Mode to Optimistic
MariaDB [(none)]> stop all slaves;
Query OK, 0 rows affected, 3 warnings (0.00 sec)
 
MariaDB [(none)]> set global box02.slave_parallel_mode='optimistic';
Query OK, 0 rows affected (0.00 sec)
 
MariaDB [(none)]> set global box03.slave_parallel_mode='optimistic';
Query OK, 0 rows affected (0.00 sec)
 
MariaDB [(none)]> set global box04.slave_parallel_mode='optimistic';
Query OK, 0 rows affected (0.00 sec)
 
MariaDB [(none)]> start all slaves;
Query OK, 0 rows affected, 3 warnings (0.02 sec)
 
MariaDB [(none)]> show all slaves status\G
              Connection_name: box02
                Parallel_Mode: optimistic
              Connection_name: box03
                Parallel_Mode: optimistic
              Connection_name: box04
                Parallel_Mode: optimistic
3 rows in set (0.00 sec)

The parallel threads were like:

MariaDB [(none)]> SELECT ID,TIME,STATE,USER FROM INFORMATION_SCHEMA.PROCESSLIST WHERE USER='system user';
+----+------+------------------------------------------------------------------+-------------+
| ID | TIME | STATE                                                            | USER        |
+----+------+------------------------------------------------------------------+-------------+
| 46 |   81 | Slave has read all relay log; waiting for the slave I/O thread t | system user |
| 45 |   81 | Waiting for master to send event                                 | system user |
| 44 |   86 | Slave has read all relay log; waiting for the slave I/O thread t | system user |
| 43 |   86 | Waiting for master to send event                                 | system user |
| 42 |  102 | Slave has read all relay log; waiting for the slave I/O thread t | system user |
| 41 |  102 | Waiting for master to send event                                 | system user |
| 35 |    0 | Waiting for prior transaction to commit                          | system user |
| 34 |    0 | Waiting for prior transaction to commit                          | system user |
| 33 |    0 | Waiting for prior transaction to commit                          | system user |
| 32 |  175 | Waiting for work from SQL thread                                 | system user |
| 31 |  175 | Waiting for work from SQL thread                                 | system user |
| 30 |    0 | Unlocking tables                                                 | system user |
| 29 |    0 | Unlocking tables                                                 | system user |
| 28 |    0 | Unlocking tables                                                 | system user |
| 27 |  175 | Waiting for work from SQL thread                                 | system user |
| 26 |  175 | Waiting for work from SQL thread                                 | system user |
+----+------+------------------------------------------------------------------+-------------+
16 rows in set (0.00 sec)

Additionally, I’m curious to check now the Retried_transactions per connection Name variable to check if the retry transactions part of the optimistic parallel replication mode is really working:

MariaDB [(none)]> pager egrep "Connection|Parallel|Gtid_IO|Retried"
PAGER set to 'egrep "Connection|Parallel|Gtid_IO|Retried"'
MariaDB [(none)]> show all slaves status\G
              Connection_name: box02
                  Gtid_IO_Pos: 1-1-68,4-4-87933,3-3-77410,2-2-149378
                Parallel_Mode: optimistic
         Retried_transactions: 12
              Connection_name: box03
                  Gtid_IO_Pos: 1-1-68,4-4-87933,3-3-88622,2-2-131340
                Parallel_Mode: optimistic
         Retried_transactions: 3
              Connection_name: box04
                  Gtid_IO_Pos: 1-1-68,4-4-98365,3-3-77410,2-2-131340
                Parallel_Mode: optimistic
         Retried_transactions: 3
3 rows in set (0.02 sec)

Additionally, we can check that the global status variable Slave_retried_transactions finnally reflects the total value to retried transactions by Connection Names on MSR Slave:

MariaDB [(none)]> show global status like 'Slave_retried%';
+----------------------------+-------+
| Variable_name              | Value |
+----------------------------+-------+
| Slave_retried_transactions | 18    |
+----------------------------+-------+
1 row in set (0.00 sec)

So, it’s solved, slave hasn’t crashed anymore, but the question why did the MSR Slave crashed is not solved yet. But, what was learnt here was that, we can use also minimal besides of conservative for slave_parallel_mode that will play very good in this case as it’s going to only parallelizes the commit steps of transactions, this is the next test I would like to realize as the next step on this ever growing post. I’m going to try another post to check the relation between transaction’s conflicts rate and performance impact over the exiting slave parallel mode.

AddThis Social Bookmark Button

Exploring InnoDB Schema Partial Backups with Percona Xtrabackup

março 31st, 2015 | by: Bianchi | Posted in: MySQL Tuning | No Comments »

logo_percona_xtrabackup_newI remember the time when all the database and sys admins used to speak about MySQL backup strategy and it was really something to not worry about too much for many reasons. One of them was that the dataset on MySQL schemas was not too big, not that critical and the information was not that sensible such as today. Yes, as time went by, I’ve seen many organisations using MySQL to store really sensible information such as banks, vehicles manufactures and critical information in a sense of “we must be ready all time, my customer needs our services 24×7“.

This is not just Facebook or Twitter, even LinkedIn or Google, but, many companies around the world such as Booking.com needs systems ready all the time. Regardless of their scale-out or HA strategy, a good tool for export/import tables and even backing up databases is too important and this is what I’ve planned to write here to register all my adventures with xtrabackup and InnoDB. If you run MyISAM, maybe you can face a simple script to cold backup tables and period end, considering FLUSH TABLES WITH READ LOCK or even a moment in which you can just put down everything, copy files and put the database backup up again (can be a little bit different and not that simpler, but, it’s something like that).

The scenario of partial backups

Starting up with a sample of the online documentation:

There is only one caveat about partial backups: do not copy back the prepared backup. Restoring partial backups should be done by importing the tables, not by using the traditional –copy-back option. Although there are some scenarios where restoring can be done by copying back the files, this may be lead to database inconsistencies in many cases and it is not the recommended way to do it.

My problem was very clear at the first sight, we’ve got a huge amount of information on our MySQL’s schemas and part of the biggest one is not needed to be backed up. Explaining more about the scenario, there are 29 schemas and the biggest one is not completely necessary to be backed up due to our business rules. A special SLAVE server that is dedicated to sales processes does not need the whole dataset of the biggest schema and then, we don’t need to spent all the server’s disk space with useless data (in the context of this slave server). Besides that, a huge list of replicate-ignore-table can be found in the MySQL configuration file and from that I start thinking about how to solve this problem using partial backups with a file listing all the tables part of a backup!

The first step was to select all the tables of the biggest schema, different of those pointed out in replicate-ignore-table options and the have the results into a file. Second step was to select all other schemas different then the biggest schema. Bottom line, I merges files and got the file to backup just the tables of my interest in this task. Unfortunately I cannot post the real data I’ve worked with for obvious reasons, but, I will try to use some examples…

#: let's create some databases

mysql> create database db1;
Query OK, 1 row affected (0.03 sec)

mysql> create database db2;
Query OK, 1 row affected (0.00 sec)

mysql> create database db3;
Query OK, 1 row affected (0.00 sec)

#: let's create some tables

mysql> create table db1.t1(i int);
Query OK, 0 rows affected (0.31 sec)

mysql> create table db1.t2(i int);
Query OK, 0 rows affected (0.24 sec)

mysql> create table db1.t3(i int);
Query OK, 0 rows affected (0.04 sec)

mysql> create table db2.t1(i int);
Query OK, 0 rows affected (0.22 sec)

mysql> create table db2.t2(i int);
Query OK, 0 rows affected (0.22 sec)

mysql> create table db2.t3(i int);
Query OK, 0 rows affected (0.30 sec)

mysql> create table db3.t1(i int);
Query OK, 0 rows affected (0.41 sec)

mysql> create table db3.t2(i int);
Query OK, 0 rows affected (0.32 sec)

mysql> create table db3.t3(i int);
Query OK, 0 rows affected (0.18 sec)

This way, I’ve got the following MySQL’s structures upon disk:

[root@mysql01 opt]# mysqldiskusage --server=root:123456@localhost:3306:/var/lib/mysql/mysql.sock --all
WARNING: Using a password on the command line interface can be insecure.
# Source on localhost: ... connected.
# Database totals:
+---------------------+------------+
| db_name             |     total  |
+---------------------+------------+
| db1                 | 373,887    |
| db2                 | 373,887    |
| db3                 | 373,887    |
| mysql               | 1,577,981  |
| performance_schema  | 489,543    |
+---------------------+------------+

Total database disk usage = 3,189,185 bytes or 3.04 MB

# Log information.
# The general_log is turned off on the server.
# The slow_query_log is turned off on the server.
+-------------+---------+
| log_name    |   size  |
+-------------+---------+
| mysqld.log  | 36,043  |
+-------------+---------+

Total size of logs = 36,043 bytes or 35.20 KB

# Binary log information:
Current binary log file = mysql01-bin.000041
+---------------------+-------+
| log_file            | size  |
+---------------------+-------+
| mysql01-bin.000001  | 1825  |
| mysql01-bin.000002  | 570   |
| mysql01-bin.000003  | 240   |
| mysql01-bin.000004  | 240   |
[...]
| mysql01-bin.index   | 1280  |
+---------------------+-------+

Total size of binary logs = 15,234 bytes or 14.88 KB

# Relay log information:
Current relay log file = mysqld-relay-bin.000003
+--------------------------+-------+
| log_file                 | size  |
+--------------------------+-------+
| mysqld-relay-bin.000003  | 143   |
| mysqld-relay-bin.000004  | 143   |
| mysqld-relay-bin.000005  | 120   |
| mysqld-relay-bin.index   | 78    |
+--------------------------+-------+

Total size of relay logs = 484 bytes

# InnoDB tablespace information:
+--------------+-------------+
| innodb_file  |       size  |
+--------------+-------------+
| ib_logfile0  | 50,331,648  |
| ib_logfile1  | 50,331,648  |
| ibdata1      | 12,582,912  |
+--------------+-------------+

Total size of InnoDB files = 113,246,208 bytes or 108.00 MB

#...done.

Ok, after this creation processes to simulate what I’m going to blog here, I’ll assume that the the biggest schema here is the db1 and we don’t need to backup all the tables. The only table on db1 that is required for this backup is t1 and then, all other databases including mysql and performance_schema are required (even having the mysql_upgrade execution creating/upgrading performance_schema by chance). This way I can get now the list of tables of all databases excluding those I don’t want from the db1 – t2, t3.

mysql> SELECT CONCAT(TABLE_SCHEMA,'.',TABLE_NAME) INTO OUTFILE '/tmp/tablenames-db1' LINES TERMINATED BY '\n' 
    -> FROM INFORMATION_SCHEMA.TABLES WHERE TABLE_SCHEMA='db1' AND TABLE_NAME NOT IN ('t2','t3');
Query OK, 1 row affected (0.00 sec)

mysql> \! cat /tmp/tablenames-db1
db1.t1

mysql> SELECT CONCAT(TABLE_SCHEMA,'.',TABLE_NAME) INTO OUTFILE '/tmp/tablename' LINES TERMINATED BY '\n' 
    -> FROM INFORMATION_SCHEMA.TABLES WHERE TABLE_SCHEMA IN ('db2','db3','mysql', 'performance_schema');
Query OK, 86 rows affected (0.00 sec)

mysql> \! cat /tmp/tablenames-db1 >> /tmp/tablename

mysql> \! cat /tmp/tablename
db2.t1
db2.t2
db2.t3
db3.t1
db3.t2
db3.t3
mysql.columns_priv
mysql.db
mysql.event
mysql.func
mysql.general_log
mysql.help_category
mysql.help_keyword
mysql.help_relation
mysql.help_topic
mysql.innodb_index_stats
mysql.innodb_table_stats
mysql.ndb_binlog_index
mysql.plugin
mysql.proc
mysql.procs_priv
mysql.proxies_priv
mysql.servers
mysql.slave_master_info
mysql.slave_relay_log_info
mysql.slave_worker_info
mysql.slow_log
mysql.tables_priv
mysql.time_zone
mysql.time_zone_leap_second
mysql.time_zone_name
mysql.time_zone_transition
mysql.time_zone_transition_type
mysql.user
performance_schema.accounts
performance_schema.cond_instances
performance_schema.events_stages_current
performance_schema.events_stages_history
performance_schema.events_stages_history_long
performance_schema.events_stages_summary_by_account_by_event_name
performance_schema.events_stages_summary_by_host_by_event_name
performance_schema.events_stages_summary_by_thread_by_event_name
performance_schema.events_stages_summary_by_user_by_event_name
performance_schema.events_stages_summary_global_by_event_name
performance_schema.events_statements_current
performance_schema.events_statements_history
performance_schema.events_statements_history_long
performance_schema.events_statements_summary_by_account_by_event_name
performance_schema.events_statements_summary_by_digest
performance_schema.events_statements_summary_by_host_by_event_name
performance_schema.events_statements_summary_by_thread_by_event_name
performance_schema.events_statements_summary_by_user_by_event_name
performance_schema.events_statements_summary_global_by_event_name
performance_schema.events_waits_current
performance_schema.events_waits_history
performance_schema.events_waits_history_long
performance_schema.events_waits_summary_by_account_by_event_name
performance_schema.events_waits_summary_by_host_by_event_name
performance_schema.events_waits_summary_by_instance
performance_schema.events_waits_summary_by_thread_by_event_name
performance_schema.events_waits_summary_by_user_by_event_name
performance_schema.events_waits_summary_global_by_event_name
performance_schema.file_instances
performance_schema.file_summary_by_event_name
performance_schema.file_summary_by_instance
performance_schema.host_cache
performance_schema.hosts
performance_schema.mutex_instances
performance_schema.objects_summary_global_by_type
performance_schema.performance_timers
performance_schema.rwlock_instances
performance_schema.session_account_connect_attrs
performance_schema.session_connect_attrs
performance_schema.setup_actors
performance_schema.setup_consumers
performance_schema.setup_instruments
performance_schema.setup_objects
performance_schema.setup_timers
performance_schema.socket_instances
performance_schema.socket_summary_by_event_name
performance_schema.socket_summary_by_instance
performance_schema.table_io_waits_summary_by_index_usage
performance_schema.table_io_waits_summary_by_table
performance_schema.table_lock_waits_summary_by_table
performance_schema.threads
performance_schema.users
db1.t1

This way I produced the file to be used with the option –tables-file. Ok, now it’s time for the backup:

[root@mysql01 opt]# sudo innobackupex --user=root --password=123456 --tables-file=/tmp/tablename --history=partial01 /opt

InnoDB Backup Utility v1.5.1-xtrabackup; Copyright 2003, 2009 Innobase Oy
and Percona LLC and/or its affiliates 2009-2013.  All Rights Reserved.

This software is published under
the GNU GENERAL PUBLIC LICENSE Version 2, June 1991.

Get the latest version of Percona XtraBackup, documentation, and help resources:
http://www.percona.com/xb/p

150331 17:32:29  innobackupex: Connecting to MySQL server with DSN 'dbi:mysql:;mysql_read_default_group=xtrabackup' as 'root'  (using password: YES).
150331 17:32:29  innobackupex: Connected to MySQL server
150331 17:32:29  innobackupex: Executing a version check against the server...
150331 17:32:29  innobackupex: Done.
150331 17:32:29  innobackupex: Starting the backup operation

IMPORTANT: Please check that the backup run completes successfully.
           At the end of a successful backup run innobackupex
           prints "completed OK!".

innobackupex:  Using server version 5.6.23-log

innobackupex: Created backup directory /opt/2015-03-31_17-32-29

150331 17:32:29  innobackupex: Starting ibbackup with command: xtrabackup  --defaults-group="mysqld" --backup --suspend-at-end --target-dir=/opt/2015-03-31_17-32-29 --innodb_log_file_size="50331648" --innodb_data_file_path="ibdata1:12M:autoextend" --tmpdir=/tmp --extra-lsndir='/tmp' --tables_file='/tmp/tablename'
innobackupex: Waiting for ibbackup (pid=4771) to suspend
innobackupex: Suspend file '/opt/2015-03-31_17-32-29/xtrabackup_suspended_2'

xtrabackup version 2.2.10 based on MySQL server 5.6.22 Linux (x86_64) (revision id: )
xtrabackup: uses posix_fadvise().
xtrabackup: cd to /var/lib/mysql
xtrabackup: open files limit requested 0, set to 1024
xtrabackup: using the following InnoDB configuration:
xtrabackup:   innodb_data_home_dir = ./
xtrabackup:   innodb_data_file_path = ibdata1:12M:autoextend
xtrabackup:   innodb_log_group_home_dir = ./
xtrabackup:   innodb_log_files_in_group = 2
xtrabackup:   innodb_log_file_size = 50331648
>> log scanned up to (1694982)
xtrabackup: Generating a list of tablespaces
>> log scanned up to (1694982)
[01] Copying ./ibdata1 to /opt/2015-03-31_17-32-29/ibdata1
[01]        ...done
>> log scanned up to (1694982)
[01] Copying ./mysql/innodb_index_stats.ibd to /opt/2015-03-31_17-32-29/mysql/innodb_index_stats.ibd
[01]        ...done
[01] Copying ./mysql/slave_worker_info.ibd to /opt/2015-03-31_17-32-29/mysql/slave_worker_info.ibd
[01]        ...done
[01] Copying ./mysql/innodb_table_stats.ibd to /opt/2015-03-31_17-32-29/mysql/innodb_table_stats.ibd
[01]        ...done
[01] Copying ./mysql/slave_master_info.ibd to /opt/2015-03-31_17-32-29/mysql/slave_master_info.ibd
[01]        ...done
[01] Copying ./mysql/slave_relay_log_info.ibd to /opt/2015-03-31_17-32-29/mysql/slave_relay_log_info.ibd
[01]        ...done
[01] Copying ./db3/t1.ibd to /opt/2015-03-31_17-32-29/db3/t1.ibd
[01]        ...done
[01] Copying ./db3/t2.ibd to /opt/2015-03-31_17-32-29/db3/t2.ibd
[01]        ...done
>> log scanned up to (1694982)
[01] Copying ./db3/t3.ibd to /opt/2015-03-31_17-32-29/db3/t3.ibd
[01]        ...done
[01] Copying ./db2/t1.ibd to /opt/2015-03-31_17-32-29/db2/t1.ibd
[01]        ...done
[01] Copying ./db2/t2.ibd to /opt/2015-03-31_17-32-29/db2/t2.ibd
[01]        ...done
[01] Copying ./db2/t3.ibd to /opt/2015-03-31_17-32-29/db2/t3.ibd
[01]        ...done
[01] Copying ./db1/t1.ibd to /opt/2015-03-31_17-32-29/db1/t1.ibd
[01]        ...done
>> log scanned up to (1694982)
xtrabackup: Creating suspend file '/opt/2015-03-31_17-32-29/xtrabackup_suspended_2' with pid '4771'

150331 17:32:34  innobackupex: Continuing after ibbackup has suspended
150331 17:32:34  innobackupex: Executing FLUSH TABLES WITH READ LOCK...
150331 17:32:34  innobackupex: All tables locked and flushed to disk

150331 17:32:34  innobackupex: Starting to backup non-InnoDB tables and files
innobackupex: in subdirectories of '/var/lib/mysql/'
innobackupex: Backing up files '/var/lib/mysql//mysql/*.{frm,isl,MYD,MYI,MAD,MAI,MRG,TRG,TRN,ARM,ARZ,CSM,CSV,opt,par}' (74 files)
>> log scanned up to (1694982)
innobackupex: Backing up files '/var/lib/mysql//performance_schema/*.{frm,isl,MYD,MYI,MAD,MAI,MRG,TRG,TRN,ARM,ARZ,CSM,CSV,opt,par}' (53 files)
>> log scanned up to (1694982)
innobackupex: Backing up file '/var/lib/mysql//db3/t3.frm'
innobackupex: Backing up file '/var/lib/mysql//db3/t1.frm'
innobackupex: Backing up file '/var/lib/mysql//db3/t2.frm'
>> log scanned up to (1694982)
innobackupex: Backing up file '/var/lib/mysql//db2/t3.frm'
innobackupex: Backing up file '/var/lib/mysql//db2/t1.frm'
innobackupex: Backing up file '/var/lib/mysql//db2/t2.frm'
innobackupex: Backing up file '/var/lib/mysql//db1/t1.frm'
150331 17:32:38  innobackupex: Finished backing up non-InnoDB tables and files

150331 17:32:38  innobackupex: Executing FLUSH NO_WRITE_TO_BINLOG ENGINE LOGS...
150331 17:32:38  innobackupex: Waiting for log copying to finish

xtrabackup: The latest check point (for incremental): '1694982'
xtrabackup: Stopping log copying thread.
.>> log scanned up to (1694982)

xtrabackup: Creating suspend file '/opt/2015-03-31_17-32-29/xtrabackup_log_copied' with pid '4771'
xtrabackup: Transaction log of lsn (1694982) to (1694982) was copied.
150331 17:32:39  innobackupex: All tables unlocked

innobackupex: Backup created in directory '/opt/2015-03-31_17-32-29'
innobackupex: MySQL binlog position: GTID of the last change 'f2b66a45-ce62-11e4-8a01-0800274fb806:1-18'
innobackupex: Backup history record uuid edfd8656-d7cb-11e4-9cd1-0800274fb806 successfully written
150331 17:32:40  innobackupex: Connection to database server closed
150331 17:32:40  innobackupex: completed OK!

Observing carefully the xtrabackup output, one can quickly see that the tables we left out really stayed out and this is the result I was looking for, not news here. Until now we’ve been working to get things working s clearly as possible and work like a charm. But, this is not enough to avoid problems when using the backup directory produced by xtrabackup (in this case, /opt/2015-03-31_17-32-29). If one use the /opt/2015-03-31_17-32-29 as MySQL DATADIR at this point, when start up mysqld, this error message below will be seen for each table which is not part of the backup:

2015-03-30 21:27:56 44823 [ERROR] InnoDB: Tablespace open failed for '"db1"."t2"', ignored.
2015-03-30 21:27:56 7ff5d9f92720  InnoDB: Operating system error number 2 in a file operation.
InnoDB: The error means the system cannot find the path specified.
InnoDB: If you are installing InnoDB, remember that you must create
InnoDB: directories yourself, InnoDB does not create them.

2015-03-30 21:27:56 44823 [ERROR] InnoDB: Tablespace open failed for '"db1"."t3"', ignored.
2015-03-30 21:27:56 7ff5d9f92720  InnoDB: Operating system error number 2 in a file operation.
InnoDB: The error means the system cannot find the path specified.
InnoDB: If you are installing InnoDB, remember that you must create
InnoDB: directories yourself, InnoDB does not create them.

To avoid this, a second step is needed to clean out all the metadata from ibdata1 (prepare phase!!):

[root@mysql01 opt]# sudo innobackupex --user=root --password=123456 --apply-log /opt/2015-03-31_17-32-29

InnoDB Backup Utility v1.5.1-xtrabackup; Copyright 2003, 2009 Innobase Oy
and Percona LLC and/or its affiliates 2009-2013.  All Rights Reserved.

This software is published under
the GNU GENERAL PUBLIC LICENSE Version 2, June 1991.

Get the latest version of Percona XtraBackup, documentation, and help resources:
http://www.percona.com/xb/p

150331 17:41:06  innobackupex: Starting the apply-log operation

IMPORTANT: Please check that the apply-log run completes successfully.
           At the end of a successful apply-log run innobackupex
           prints "completed OK!".


150331 17:41:07  innobackupex: Starting ibbackup with command: xtrabackup  --defaults-file="/opt/2015-03-31_17-32-29/backup-my.cnf"  --defaults-group="mysqld" --prepare --target-dir=/opt/2015-03-31_17-32-29

xtrabackup version 2.2.10 based on MySQL server 5.6.22 Linux (x86_64) (revision id: )
xtrabackup: cd to /opt/2015-03-31_17-32-29
xtrabackup: This target seems to be not prepared yet.
xtrabackup: xtrabackup_logfile detected: size=2097152, start_lsn=(1694982)
xtrabackup: using the following InnoDB configuration for recovery:
xtrabackup:   innodb_data_home_dir = ./
xtrabackup:   innodb_data_file_path = ibdata1:12M:autoextend
xtrabackup:   innodb_log_group_home_dir = ./
xtrabackup:   innodb_log_files_in_group = 1
xtrabackup:   innodb_log_file_size = 2097152
xtrabackup: Starting InnoDB instance for recovery.
xtrabackup: Using 104857600 bytes for buffer pool (set by --use-memory parameter)
InnoDB: Using atomics to ref count buffer pool pages
InnoDB: The InnoDB memory heap is disabled
InnoDB: Mutexes and rw_locks use GCC atomic builtins
InnoDB: Memory barrier is not used
InnoDB: Compressed tables use zlib 1.2.3
InnoDB: Not using CPU crc32 instructions
InnoDB: Initializing buffer pool, size = 100.0M
InnoDB: Completed initialization of buffer pool
InnoDB: Highest supported file format is Barracuda.
InnoDB: The log sequence numbers 1638299 and 1638299 in ibdata files do not match the log sequence number 1694982 in the ib_logfiles!
InnoDB: Database was not shutdown normally!
InnoDB: Starting crash recovery.
InnoDB: Reading tablespace information from the .ibd files...
InnoDB: Restoring possible half-written data pages
InnoDB: from the doublewrite buffer...
InnoDB: Last MySQL binlog file position 0 1802, file name mysql01-bin.000001
InnoDB: Table db1/t2 in the InnoDB data dictionary has tablespace id 8, but tablespace with that id or name does not exist. Have you deleted or moved .ibd files? This may also be a table created with CREATE TEMPORARY TABLE whose .ibd and .frm files MySQL automatically removed, but the table still exists in the InnoDB internal data dictionary.
InnoDB: It will be removed from the data dictionary.
InnoDB: Please refer to
InnoDB: http://dev.mysql.com/doc/refman/5.6/en/innodb-troubleshooting-datadict.html
InnoDB: for how to resolve the issue.
InnoDB: Table db1/t3 in the InnoDB data dictionary has tablespace id 9, but tablespace with that id or name does not exist. Have you deleted or moved .ibd files? This may also be a table created with CREATE TEMPORARY TABLE whose .ibd and .frm files MySQL automatically removed, but the table still exists in the InnoDB internal data dictionary.
InnoDB: It will be removed from the data dictionary.
InnoDB: Please refer to
InnoDB: http://dev.mysql.com/doc/refman/5.6/en/innodb-troubleshooting-datadict.html
InnoDB: for how to resolve the issue.
InnoDB: 128 rollback segment(s) are active.
InnoDB: Waiting for purge to start
InnoDB: 5.6.22 started; log sequence number 1694982

[notice (again)]
  If you use binary log and don't use any hack of group commit,
  the binary log position seems to be:
InnoDB: Last MySQL binlog file position 0 1802, file name mysql01-bin.000001

xtrabackup: starting shutdown with innodb_fast_shutdown = 1
InnoDB: FTS optimize thread exiting.
InnoDB: Starting shutdown...
InnoDB: Shutdown completed; log sequence number 1696565

150331 17:41:10  innobackupex: Restarting xtrabackup with command: xtrabackup  --defaults-file="/opt/2015-03-31_17-32-29/backup-my.cnf"  --defaults-group="mysqld" --prepare --target-dir=/opt/2015-03-31_17-32-29
for creating ib_logfile*

xtrabackup version 2.2.10 based on MySQL server 5.6.22 Linux (x86_64) (revision id: )
xtrabackup: cd to /opt/2015-03-31_17-32-29
xtrabackup: This target seems to be already prepared.
xtrabackup: notice: xtrabackup_logfile was already used to '--prepare'.
xtrabackup: using the following InnoDB configuration for recovery:
xtrabackup:   innodb_data_home_dir = ./
xtrabackup:   innodb_data_file_path = ibdata1:12M:autoextend
xtrabackup:   innodb_log_group_home_dir = ./
xtrabackup:   innodb_log_files_in_group = 2
xtrabackup:   innodb_log_file_size = 50331648
xtrabackup: Starting InnoDB instance for recovery.
xtrabackup: Using 104857600 bytes for buffer pool (set by --use-memory parameter)
InnoDB: Using atomics to ref count buffer pool pages
InnoDB: The InnoDB memory heap is disabled
InnoDB: Mutexes and rw_locks use GCC atomic builtins
InnoDB: Memory barrier is not used
InnoDB: Compressed tables use zlib 1.2.3
InnoDB: Not using CPU crc32 instructions
InnoDB: Initializing buffer pool, size = 100.0M
InnoDB: Completed initialization of buffer pool
InnoDB: Setting log file ./ib_logfile101 size to 48 MB
InnoDB: Setting log file ./ib_logfile1 size to 48 MB
InnoDB: Renaming log file ./ib_logfile101 to ./ib_logfile0
InnoDB: New log files created, LSN=1696565
InnoDB: Highest supported file format is Barracuda.
InnoDB: 128 rollback segment(s) are active.
InnoDB: Waiting for purge to start
InnoDB: 5.6.22 started; log sequence number 1696780

[notice (again)]
  If you use binary log and don't use any hack of group commit,
  the binary log position seems to be:
InnoDB: Last MySQL binlog file position 0 1802, file name mysql01-bin.000001

xtrabackup: starting shutdown with innodb_fast_shutdown = 1
InnoDB: FTS optimize thread exiting.
InnoDB: Starting shutdown...
InnoDB: Shutdown completed; log sequence number 1696790
150331 17:41:12  innobackupex: completed OK!

Doing this way, one can just transfer the backupset, if it’s huge size, try ftp files between servers, change the owner of the new directory and point MySQL’s DATADIR variable to it and finally, restart mysqld monitoring the error log:

150331 17:46:32 mysqld_safe Starting mysqld daemon with databases from /opt/2015-03-31_17-32-29
2015-03-31 17:46:33 4759 [Note] Plugin 'FEDERATED' is disabled.
2015-03-31 17:46:34 4759 [Note] InnoDB: Using atomics to ref count buffer pool pages
2015-03-31 17:46:34 4759 [Note] InnoDB: The InnoDB memory heap is disabled
2015-03-31 17:46:34 4759 [Note] InnoDB: Mutexes and rw_locks use GCC atomic builtins
2015-03-31 17:46:34 4759 [Note] InnoDB: Memory barrier is not used
2015-03-31 17:46:34 4759 [Note] InnoDB: Compressed tables use zlib 1.2.3
2015-03-31 17:46:34 4759 [Note] InnoDB: Using Linux native AIO
2015-03-31 17:46:34 4759 [Note] InnoDB: Not using CPU crc32 instructions
2015-03-31 17:46:34 4759 [Note] InnoDB: Initializing buffer pool, size = 128.0M
2015-03-31 17:46:34 4759 [Note] InnoDB: Completed initialization of buffer pool
2015-03-31 17:46:34 4759 [Note] InnoDB: Highest supported file format is Barracuda.
2015-03-31 17:46:34 4759 [Note] InnoDB: 128 rollback segment(s) are active.
2015-03-31 17:46:34 4759 [Note] InnoDB: Waiting for purge to start
2015-03-31 17:46:34 4759 [Note] InnoDB: 5.6.23 started; log sequence number 1696790
2015-03-31 17:46:35 4759 [Note] Server hostname (bind-address): '*'; port: 3306
2015-03-31 17:46:35 4759 [Note] IPv6 is available.
2015-03-31 17:46:35 4759 [Note]   - '::' resolves to '::';
2015-03-31 17:46:35 4759 [Note] Server socket created on IP: '::'.
2015-03-31 17:46:36 4759 [Note] Event Scheduler: Loaded 0 events
2015-03-31 17:46:36 4759 [Note] /usr/sbin/mysqld: ready for connections.
Version: '5.6.23-log'  socket: '/var/lib/mysql/mysql.sock'  port: 3306  MySQL Community Server (GPL)

It must be as clean as possible to convince that everything went well with the backupset produce and with all the processes to get it done. I’ve just tried it with log_warnings=3 and ended up getting a clean log once again.

Some questions have brought on your mind? Fire up a comment!!

Tags: , , , ,

AddThis Social Bookmark Button

Working with MySQL on SSD

novembro 6th, 2014 | by: Bianchi | Posted in: MySQL A&D, MySQL Tuning | No Comments »

I’d like to start this post or entry registering that even SSD cards or disks provides very low latency and faster random reads/writes, I consider that it’s new to MySQLers and at least on MySQL World. New based on the information we can find on the internet in form of collaboration to make it to run maybe “like a charm” and by the presentations we’ve been seeing more and more on the last months. Things like SLC and MLC have been better explained now than before and what I’ve seen is that MySQL Team has collaborate a lot with all these *new* things to make the software of MySQL to scale more in terms of I/O usage, delivering better results in terms simple SELECT queries to heavy ALTER TABLE. What I’ve waited when SSD come into a plan of a special customer I’m working with in Brazil is that all the queries could perform better just by being over faster disks – this is not true. Many tests have been done where I’m using sysbench 0.5 and more than table as discussed on twitter with @cpeintre, @morgo and @stoker. Sysbench results will be on focus soon in this post.

Presenting, Dell Compellent SC8000, the storage!

My first desire was to have Fusion IO cards to run some MySQL’s files on that, to make it easier as the market is doing that since some time ago. I’ve seen for years many guys speaking about those flash cards delivering lots of IOPS and making MySQL run faster. BTW, when our Dell’s contact presented the Dell Compellent SC8000, we saw the possibility to expand the IT environment towards a more professional environment and due to the possibility to scale the hardware in case we need to provide more space on our database layer. This storage, aka “external storage” represents a large investment and a giant step in terms of environment professionalism and was thought like a something that will provide all the needed IOPS and speed we need to solve problems of queries to feed reports to replication lags that happens with no sense (we can go into details of it later on another post). Detailing so the storage, it has an intelligence to always write on SLC flash disks organized in RAID 10 (tier 1), always read from MLC flash disks organized in RAID 5 (tier 2) and not accessed data/pages are moved *initially* in 12 days to the 10k mechanic disks in RAID 6 which is the tier 3.

Additionally, the tier 2 is the hot area where all the more accessed data resides. When a data is inserted into the database, it’s moved to tier 2 in background and if not accessed, moved away to mechanical disks, less privileged area. It seems to me that internally this storage has a kind of hash table with all the pages contained on the hot area, that is, tier 2, and from times to times it is going to move the less accessed pages. In case of tier 2 gets full, less accessed pages will be moved to tier 3 before the 12th day. Basically, once can choose a profile to create a new LUN. This profile can be comprised by tier 1 only, tier 2 only, tier 3 only or any combination among them. The connectivity among storage and servers is done by a dedicated fiber channel network, using a HBA of 8GB Dual Port (round-robin).

Nice…it’s flexible. More here…

Test with FIO

Theoretically, all those things seemed OK and we went for a test for FIO. The test went very well, and it’s just create a LUN with a profile such as “automatic”, containing all the existent tiers and mount it on a Linux machine, which is Red Hat 6.5. After writing a configuration file to be read by FIO simulating what MySQL does on our environment, it was executed on both scenarios: (NDB2) our server running all MySQL files on HDD, (NDB3) on the other server running MySQL files on SSD. The FIO script is that below:

[random-writes]
; this test was written by Bianchi
; me at wagnerbianchi.com
runtime=1800 # 30mins
size=2G
threads=1
numjobs=16
ioengine=libaio
iodepth=32
bs=5k
; innodb related stuff
lockfile=readwrite # simulating row-locking
rw=randwrite       # writing in pages randomly
direct=0           # O_DSYNC
sync=0             # O_DSYNC
refill_buffers     # Buffer Pool load pages
openfiles=1000

My intention configuring direct=0 and sync=0 was to perform the same thing we have on our current production environment, deliver all the writes to a battery backed cache and get back. The test results:

Server Job # IO (MB) IO (Qtd) TIME (ms)
NDB2     1   1965.4       368   1091316
NDB2     2   2047.2       498    841042
NDB2     3   2047.2       380   1103541
NDB2     4   1704.3       443    787271
NDB2     5   2047.2       471    889231
NDB2     6   2015.6       434    951029
NDB2     7   2047.2       411   1020253
NDB2     8   2047.2       387   1081822
NDB2     9   2047.2       481    870714
NDB2    10   2011.1       549    749626
NDB2    11   1633.6       740    452040
NDB2    12   2047.2       488    858940
NDB2    13   2047.2       378   1107883
NDB2    14   1945.6       602    661052
NDB2    15   2047.2       585    716770
NDB2    16   2000.9       601    680994

NDB2-FIO

Server  Job # IO (MB) IO (Qtd) TIME (ms)
STORAGE     1  1965.4     2115    190270
STORAGE     2  2047.2     2925    143387
STORAGE     3  2047.2     3212    130562
STORAGE     4  1704.3     2910    119915
STORAGE     5  2047.2     3010    139334
STORAGE     6  2015.6     2138    193032
STORAGE     7  2047.2     3073    136465
STORAGE     8  2047.2     2791    150233
STORAGE     9  2047.2     2415    173628
STORAGE    10  2011.1     3027    136085
STORAGE    11  1633.6     2186    153012
STORAGE    12  2047.2     2700    155319
STORAGE    13  2047.2     2779    150917
STORAGE    14  1945.6     2886    138059
STORAGE    15  2047.2     2785    150573
STORAGE    16  2000.9     2865    142991

STG-FIO

While IOPS are a way more on SSD, latency behavior is a way less. Next step was to setup everything and get the storage working inside our main DC and mount a LUN on some server to carry on with tests. The first sysbench I ran was was using Percona Server 5.5.37.1 and even configuring innodb_adaptive_flush_method as keep_average, neighbor pages as area and changing the redo logs block size to 4096, MySQL wasn’t able to use all the I/O we were waiting. it was a time that, speaking with @morgo, the version upgrade come into the scene and I went for it. The only barrier I had upgrading the 5.5 to 5.6 was the question around temporal data types we discussed with some folks on the Official MySQL Forum. Even having the replication between 5.5.37 (master prod) and 5.6.21 (new comer slave with SSD) running well for more than 10 hours, I decided to apply the solution proposed by Johnaton Coombes. It’s running well until now…

Sysbench’ing

After seeing that the storage really deliver what we’re looking for to check what’s the best configuration to put MySQL to run on SSD. After reading the Matsunobu entry on his blog, I rearranged everything considering sequential written files on HDD and just tables and the shared tablespace on SSD (however it’s possible to put undo files on SSD and all other things of ibdata1 on HDD). That gave me new numbers and replication gained more throughput having relay logs accompanied by redo logs, error log and slow query logs. Thanks for @cpeintre to give a hint to have more than one table to sysbench situations and for @lefred to host sysbench rpm package on his blog (it’s nice).

innodb_flush_method and innodb_flush_logs_at_trx_commit

At this time I’ve started some tests to consider the best combination of some important parameters to better handle the InnoDB workflow. On my current environment using mechanic disks, I’ve configured mysqld to use more and more memory and file system cache, taking into account that my underlying hardware relies on some disk controllers with battery backed cache of 512MB – this permits my whole system to deliver almost 9.300K IOPS using RAID 1. My intention here is to test innodb_flush_logs_at_trx_commit as 1 when flush_method is O_DIRECT and innodb_flush_logs_at_trx_commit {0|2} when flush_method is O_DSYNC – I’d like to remember that I’m using MySQL Oracle.

Considering that O_DSYNC and flush_method as 0|2 had the same results…

Screenshot 2014-11-06 11.34.33

Let’s benchmark it so.

--innodb_io_capacity=2000
--innodb_lru_scan_depth=2500
--innodb_flush_logs_at_trx_commit=1
--innodb_flush_method=O_DIRECT
Screenshot 2014-11-06 11.18.12
 Screenshot 2014-11-06 11.18.58
--innodb_io_capacity=2000
--innodb_lru_can_depth=2500
--innodb_flush_logs_at_trx_commit=0
--innodb_flush_method=O_DSYNC
Screenshot 2014-11-06 11.22.47
Screenshot 2014-11-07 10.53.08


The final summary was:

Screenshot 2014-11-06 11.42.01
 Screenshot 2014-11-06 11.46.45

innodb_io_capacity and innodb_lru_scan_depth

After reading the blog entry written by Mark Callaghan on 2013 about these both system variables, I decided to have the value on both as a start point. As it’s well explained by Mark on his blog entry and using twitter, as here, both variables will give mysqld more IOPS if there are more resources like that on the system. So I went form 1000 to 3000 to make it reasonable for io_capacity and did the same for lru_scan.

#: Sysbench line used here:
[bianchi@ndb2 db]$ sudo sysbench --test=oltp.lua --oltp-table-size=1000000 --mysql-db=test --oltp-tables-count=10 --mysql-user=bianchi --db-driver=mysql --mysql-table-engine=innodb --max-time=300 --max-requests=0 --report-interval=60 --num-threads=500 --mysql-socket=/var/mysql/logs/mysql.sock --mysql-engine-trx=yes run

1-) "select @@innodb_io_capacity, @@innodb_lru_scan_depth, @@innodb_buffer_pool_instances;"
+----------------------+-------------------------+--------------------------------+
| @@innodb_io_capacity | @@innodb_lru_scan_depth | @@innodb_buffer_pool_instances |
+----------------------+-------------------------+--------------------------------+
|                 1000 |                    1000 |                              8 |
+----------------------+-------------------------+--------------------------------+
[  60s] threads: 500, tps: 2895.09, reads/s: 43241.46, writes/s: 11824.06, response time: 1278.56ms (95%)
[ 120s] threads: 500, tps: 2919.87, reads/s: 43432.81, writes/s: 11914.27, response time: 1387.02ms (95%)
[ 180s] threads: 500, tps: 2911.20, reads/s: 43266.95, writes/s: 11875.58, response time: 1397.43ms (95%)
[ 240s] threads: 500, tps: 2896.17, reads/s: 43039.52, writes/s: 11812.63, response time: 1385.36ms (95%)
[ 300s] threads: 500, tps: 2881.70, reads/s: 42842.40, writes/s: 11756.67, response time: 1382.87ms (95%)

2-) "select @@innodb_io_capacity, @@innodb_lru_scan_depth, @@innodb_buffer_pool_instances;"
+----------------------+-------------------------+--------------------------------+
| @@innodb_io_capacity | @@innodb_lru_scan_depth | @@innodb_buffer_pool_instances |
+----------------------+-------------------------+--------------------------------+
|                 2000 |                    2000 |                              8 |
+----------------------+-------------------------+--------------------------------+
[  60s] threads: 500, tps: 2834.36, reads/s: 42276.71, writes/s: 11570.30, response time: 1293.57ms (95%)
[ 120s] threads: 500, tps: 2964.74, reads/s: 44071.70, writes/s: 12094.58, response time: 1383.70ms (95%)
[ 180s] threads: 500, tps: 2943.48, reads/s: 43790.31, writes/s: 12011.63, response time: 1380.39ms (95%)
[ 240s] threads: 500, tps: 2940.23, reads/s: 43772.47, writes/s: 12002.10, response time: 1381.63ms (95%)
[ 300s] threads: 500, tps: 2961.58, reads/s: 44007.70, writes/s: 12079.94, response time: 1376.67ms (95%)

3-) "select @@innodb_io_capacity, @@innodb_lru_scan_depth, @@innodb_buffer_pool_instances;"
+----------------------+-------------------------+--------------------------------+
| @@innodb_io_capacity | @@innodb_lru_scan_depth | @@innodb_buffer_pool_instances |
+----------------------+-------------------------+--------------------------------+
|                 2000 |                    4000 |                              8 |
+----------------------+-------------------------+--------------------------------+
[  60s] threads: 500, tps: 2835.78, reads/s: 42283.84, writes/s: 11577.04, response time: 1287.78ms (95%)
[ 120s] threads: 500, tps: 2866.35, reads/s: 42659.13, writes/s: 11697.75, response time: 1418.51ms (95%)
[ 180s] threads: 500, tps: 2901.80, reads/s: 43129.23, writes/s: 11834.54, response time: 1383.28ms (95%)
[ 240s] threads: 500, tps: 2924.12, reads/s: 43527.28, writes/s: 11934.51, response time: 1394.09ms (95%)
[ 300s] threads: 500, tps: 2928.04, reads/s: 43537.30, writes/s: 11946.43, response time: 1390.76ms (95%)

4-) "select @@innodb_io_capacity, @@innodb_lru_scan_depth, @@innodb_buffer_pool_instances;"
+----------------------+-------------------------+--------------------------------+
| @@innodb_io_capacity | @@innodb_lru_scan_depth | @@innodb_buffer_pool_instances |
+----------------------+-------------------------+--------------------------------+
|                 2000 |                    3000 |                              8 |
+----------------------+-------------------------+--------------------------------+
[  60s] threads: 500, tps: 2915.01, reads/s: 43438.88, writes/s: 11896.84, response time: 1276.65ms (95%)
[ 120s] threads: 500, tps: 3003.12, reads/s: 44634.98, writes/s: 12248.90, response time: 1345.71ms (95%)
[ 180s] threads: 500, tps: 2983.62, reads/s: 44394.64, writes/s: 12174.23, response time: 1372.15ms (95%)
[ 240s] threads: 500, tps: 2971.40, reads/s: 44181.10, writes/s: 12122.10, response time: 1361.10ms (95%)
[ 300s] threads: 500, tps: 2976.20, reads/s: 44241.53, writes/s: 12140.61, response time: 1360.70ms (95%)

5-) "select @@innodb_io_capacity, @@innodb_lru_scan_depth, @@innodb_buffer_pool_instances;"
+----------------------+-------------------------+--------------------------------+
| @@innodb_io_capacity | @@innodb_lru_scan_depth | @@innodb_buffer_pool_instances |
+----------------------+-------------------------+--------------------------------+
|                 2000 |                    2500 |                              8 |
+----------------------+-------------------------+--------------------------------+
[  60s] threads: 500, tps: 2915.46, reads/s: 43605.14, writes/s: 11914.68, response time: 1207.51ms (95%)
[ 120s] threads: 500, tps: 2993.02, reads/s: 44541.72, writes/s: 12214.99, response time: 1358.26ms (95%)
[ 180s] threads: 500, tps: 3004.48, reads/s: 44628.71, writes/s: 12254.80, response time: 1346.52ms (95%)
[ 240s] threads: 500, tps: 3014.33, reads/s: 44839.96, writes/s: 12298.70, response time: 1366.41ms (95%)
[ 300s] threads: 500, tps: 2974.83, reads/s: 44291.42, writes/s: 12142.27, response time: 1357.04ms (95%)

Summarizing the above collected facts, in terms of…

Response Times

Screenshot 2014-11-06 15.22.32

TPS

Screenshot 2014-11-06 15.26.02

Reads/Writes

Screenshot 2014-11-06 15.25.47

innodb_log_buffer_size

This was configured used a large value and it was annoying me  a little. After fiding the Shlomi Noach blog entry with a good query to check the size of transactions that populate the log buffer, its seems very important to have in place a more accurate configuration.

ndb2 mysql> SELECT
    ->   innodb_os_log_written_per_minute*60
    ->     AS estimated_innodb_os_log_written_per_hour,
    ->   CONCAT(ROUND(innodb_os_log_written_per_minute*60/1024/1024, 1), 'MB')
    ->     AS estimated_innodb_os_log_written_per_hour_mb
    -> FROM
    ->   (SELECT SUM(value) AS innodb_os_log_written_per_minute FROM (
    ->     SELECT -VARIABLE_VALUE AS value
    ->       FROM INFORMATION_SCHEMA.GLOBAL_STATUS
    ->       WHERE VARIABLE_NAME = 'innodb_os_log_written'
    ->     UNION ALL
    ->     SELECT SLEEP(60)
    ->       FROM DUAL
    ->     UNION ALL
    ->     SELECT VARIABLE_VALUE
    ->       FROM INFORMATION_SCHEMA.GLOBAL_STATUS
    ->       WHERE VARIABLE_NAME = 'innodb_os_log_written'
    ->   ) s1
    -> ) s2
    -> \G
*************************** 1. row ***************************
   estimated_innodb_os_log_written_per_hour: 1008476160
estimated_innodb_os_log_written_per_hour_mb: 961.8MB
1 row in set (59.99 sec)

ndb2 mysql> SELECT (961.8/60)\G
*************************** 1. row ***************************
(961.8/60): 16.03000
1 row in set (0.00 sec)

Operating System Demanding Tuning

All machine servers planned to be placed upon the storage runs the Red Hat 6.5. After updating the operating systems packages we followed the recommendations of this paper released by Oracle , differing just the scheduler/elevator which we decided to use [NOOP]. In the midst of the configuration path that has run for some days, we had a case when we forgot to make this below configuration and we had a chance to see the the performance has improved by 30%, considering replication lagging and query executions for reads and writes. As the storage attached/mounted on file system is represented by an alias or device mapper (appears as dm-X) for all the underlying disks, it’s possible to configure just the device mappers in order to make all these things to work properly with NOOP.

$ echo 10000 > /sys/block/sdb/queue/nr_requests
$ echo 1024 > /sys/block/sdb/queue/max_sectors_kb
$ echo 0 > /sys/block/sdb/queue/rotational
$ echo 0 > /sys/block/sdb/queue/add_random
$ echo 0 > /sys/block/sdb/queue/rq_affinity

You can check the meaning of each configuration here on the Red Hat’s Knowledge Base. Additionally, it was very interesting to place all the above configuration on /etc/rc.local.

Replication Lagging Problems

OK, the scenario #5 is the best at all. So, my feelings are that in some point all those benchmarks done with sysbench lied completely! When I configured my server on SSD and get it replicating, catching up on master data, the lagging wasn’t decreased after an hour. Instead, the lagging increased and the slave server was getting far and far from master, almost fading away on the road. Thinking about the configuration I’ve got on my stablished environment, I decided to set it up as O_DSYNC, relying on the file system cache and storage controller battery backed cache (64GB), configuring innodb_flush_logs_at_trx_commit as 0 as well. Things started getting a little bit more faster since the lagging was stopped on the same number of Seconds_Behind_Master. Ok, I made this fucking thing to decrease when I tuned well the innodb_log_buffer_size as I told on some sections above and then replication lags disappeared, being this new server the only server that stays always behind the red state of lagging which is 50 seconds (our company threshold). First of all I configured log_buffer as 8M, but, checking properly status variables, I saw many pending syncs accumulating there. Jumped to 32M and now everything is OK. Next step as I’m running 5.6 now is to jump into this party and start using PERFORMANCE_SCHEMA and other smart things to monitor the environment in order to increase throughput and get even less response time.

By the way, until this point, I’ve run MySQL 5.6.21 with this below configuration file and Linux adjusts previously mentioned:

--innodb_io_capacity=2000
--innodb_io_capacity_max=2500
--innodb_lru_scan_depth=2500
--innodb_flush_log_at_trx_commit=2
--innodb_flush_neighbors=0
--innodb_log_group_home_dir=/var/mysql/logs
--innodb_log_files_in_group=2
--innodb_log_file_size=1024M
--innodb_buffer_pool_size=72G
--innodb_doublewrite=1
--innodb_buffer_pool_instances=10
--innodb_log_buffer_size=32M
--innodb_file_per_table=1
--innodb_file_format=BARRACUDA
--innodb_flush_method=O_DSYNC
--innodb_open_files=900000
--innodb_read_io_threads=16
--innodb_write_io_threads=16
--innodb_support_xa=0

The final comment is that when running MySQL on SSD, 5.5 is the worst case and the 5.6 make the kid a little bit better at this moment when the charts related with I/O started getting more colored in Ganglia and in the Enterprise Manager which is the storage’s monitoring center. Speaking about 5.6 yet is good to have attention on two variables which are innodb_lru_scan_depth which will handle all the I/O per Buffer Pool instance and innodb_flush_neighbors which will handle the way flush pages are done on SSD. I believe that soon I’ll have more to post here considering performance tuning related things.

AddThis Social Bookmark Button

How to MySQL 5.6 MTS? Some tips and tests…

outubro 6th, 2014 | by: Bianchi | Posted in: MySQL HA, MySQL Replication | No Comments »

In terms of new features, MTS extrapolate conceptually all the expectations seeing that it is a feature that will elevate (or at leaf will try it) all the stress that we’ve been seeing for years, having a slave server behind master in some way, files or seconds. The first thing that blink on my mid is the red mark I used to have on my personal server’s dashboard control which has called out my attention always when a slave server hangs while the master still working well. Many of time, I’ve seeing IO problems that will make slave hangs within the relay log rotation time or when executing a long report – at least four times a day, I must go and check what’s going on. BTW, due to all of that I believe that the exchange the model of single-thread for that with multiples threads will elevate the problem – I hope to have the slave servers not hanging too much anymore.

Having said that, I’ve been seeing some cases in which after implementing the MySQL 5.6 in production, properly adjusting the worker threads variable (slave_parallel_wrokers) and starting the slave, not often it’s being worked as promised. The first action when it’s not working properly is to check all the necessary configuration to get it working well, it’s not just raise up the previous mentioned and put it to run – you make sure about some small details:

  • make sure the master and slaves are MySQL 5.6++, there some information shipped with binary log events which will be read by the slaves, being executed by more than once thread (slave_parallel_threads > 1);
  • make sure slave_parallel_threads is configured with a value > 1;
  • make sure to enable Crash-Safe Replication to make it more reliable, adding master_info_repository = TABLE, relay_log_info_repository = TABLE and relay_log_recovery = ON to my.cnf file;
  • it’s going to work with binlog_format as statement or row;

There is no problem in using the bin log format as statement or row, both formats will work well since on both one can observe the entries on binary log file of all the necessary information for the workers. Another advice is that, once you’ve started MySQL replicating in a crash-safe mode, it’s not possible to alter dynamically the repositories for relay and master info on runtime for a busy server due to the workers info being stored on tables and if you change this information’s location, workers might be a little bit out of reference.

First of all, I did a test considering a customer environment where they’re running a MySQL 5.5.37 on all the master and slave servers. the strategy is to replace slave servers until we hit the master, doing finally a switchover to another server in order to upgrade the master server to MySQL 5.6 – a normal and reasonable strategy to avoid risks on production. If you get a error on any project step, time will be welcomed to study a little bit more what’s happening and then, take another step towards another task. Another point to take into account is the old_passwords (removed in 5.7) that is still available in 5.6 and must be used when users in mysql.user table remain using 16-bytes passwords. It’s a good maneuver while updating all the account’s passwords to keep old_passwords=1 configuration to give sometime to map all the accounts used by the applications to avoid problems with access denied (while taking with account’s passwords updates, configure log_warnings=2 to get all the login failed attempts and try to correct it).

Test Scenario: confirming that mysql 5.5 (master) and mysql 5.6 (slave) does not replicate with mts

As this is the scenario I’ve been see as much on many of customers I’ve visited, I decided to spend sometime and stress the possibilities around the MTS replication having a 5.5 master and a new comer, mysql 5.6 as slave. Some discussions on the internet made me believe that at some level of configuration this scenario will become possible – but, it’s not supported. After speaking to guys on MySQL Central, we discussed a lot many scenarios but some high level guys known as developers said that 5.6 used to ship some additional information on binary logs and then, the mts on slave get to know how to proceed splitting up queries (binlog_format=statement) or updates (binlog_format=row) by workers (threads) – this job is done actually by a coordinator that is a thread as well that executes stuff read from the relay logs on slave side. BTW, this all I’ve got to know after testing the environment which I raised up using Vagrant as below.

Files you’ll need to create/copy/paste – make sure you have a centos65-x86_64 box added on your vagrant boxes or alter the value of mysql55.vm.box and mysql56.vm.box in Vagrantfile configs.

wagnerbianchi02:mysql55_and_mysql56 root# ls -lh
total 24
drwxr-xr-x 3 root wheel 102B Oct 6 12:53 .vagrant
-rw-r--r-- 1 root wheel 760B Oct 6 12:53 Vagrantfile
-rw-r--r-- 1 root wheel 681B Oct 6 12:52 setup_env55.sh
-rw-r--r-- 1 root wheel 343B Oct 6 12:42 setup_env56.sh

Vagrantfile, which you can just copy/paste:

# -*- mode: ruby -*-
# vi: set ft=ruby :

file_to_disk = './tmp/galera_disk.vdi'

# Vagrantfile API/syntax version. Don't touch unless you know what you're doing!
VAGRANTFILE_API_VERSION = "2"

Vagrant.configure(VAGRANTFILE_API_VERSION) do |config|

config.vm.define "mysql55" do |mysql55|
mysql55.vm.box = "centos65-x86_64"
mysql55.vm.network :"private_network", virtualbox__intnet: "mysql55_and_mysql56", ip: "192.168.50.100"
mysql55.vm.provision "shell", path: "setup_env55.sh"
end

config.vm.define "mysql56" do |mysql56|
mysql56.vm.box = "centos65-x86_64"
mysql56.vm.network :"private_network", virtualbox__intnet: "mysql55_and_mysql56", ip: "192.168.50.101"
mysql56.vm.provision "shell", path: "setup_env56.sh"
end

end

If you get an error like this below, review the boxes you’ve got added to your Vagrant boxes:

wagnerbianchi01:mysql55_and_mysql56 root# vagrant up
Bringing machine 'mysql55' up with 'virtualbox' provider...
Bringing machine 'mysql56' up with 'virtualbox' provider...
==> mysql55: Box 'centos65-x86_64' could not be found. Attempting to find and install...
mysql55: Box Provider: virtualbox
mysql55: Box Version: >= 0
==> mysql55: Adding box 'centos65-x86_64' (v0) for provider: virtualbox
mysql55: Downloading: centos65-x86_64
An error occurred while downloading the remote file. The error
message, if any, is reproduced below. Please fix this error and try
again.

Couldn't open file /opt/vagrant_projects/mysql55_and_mysql56/centos65-x86_64

Setup scripts that you can use to create others machines:

#!/usr/bin/env bash
#: script name: setup_env55.sh
#
sudo echo "nameserver 8.8.8.8" > /etc/resolv.conf
sudo echo "nameserver 8.8.4.4" >> /etc/resolv.conf
sudo yum -y install wget vim
sudo yum -y remove mysql-libs-5.1.71-1.el6.x86_64
sudo rpm -Uvi https://dev.mysql.com/get/mysql-community-release-el6-5.noarch.rpm
sudo wget http://dev.mysql.com/get/Downloads/MySQL-5.5/MySQL-5.5.39-2.el6.x86_64.rpm-bundle.tar
sudo tar xvf MySQL-5.5.39-2.el6.x86_64.rpm-bundle.tar
sudo rpm -ivh install MySQL-{server,shared,client}*
sudo /etc/init.d/mysql start

#!/usr/bin/env bash
#: script name: setup_env56.sh
#
sudo echo "nameserver 8.8.8.8" > /etc/resolv.conf
sudo echo "nameserver 8.8.4.4" >> /etc/resolv.conf
sudo yum -y install wget vim
sudo rpm -Uvi https://dev.mysql.com/get/mysql-community-release-el6-5.noarch.rpm
sudo yum-config-manager --enable mysql56-community
sudo yum -y install mysql-server
sudo service mysqld start

Following this so is the command vagrant up and machines up & running.

wagnerbianchi01:mysql55_and_mysql56 root# vagrant status
Current machine states:

mysql55 running (virtualbox)
mysql56 running (virtualbox)

This environment represents multiple VMs. The VMs are all listed
above with their current state. For more information about a specific
VM, run `vagrant status NAME`.

Setting up additional things like classic or GTID replication (where once can do using MySQL Utilities), it’s going to be possible to execute the tests. In addition of regular and initial variables the come mainly with the 5.5 configuration file, on 5.6 I added the server_id, server_id=200, slave_worker_threads = 2, master_info_repository = TABLE, relay_log_info_repository = TABLE and relay_log_recovery = ON, for Crash-Safe Replication configurations as the 5.6 will be the slave.

mysql> mysql> select @@server_id, @@slave_parallel_workers, @@master_info_repository,
    -> @@relay_log_info_repository, @@master_info_repository, @@relay_log_recovery\G
*************************** 1. row ***************************
                @@server_id: 200
   @@slave_parallel_workers: 2
   @@master_info_repository: TABLE
@@relay_log_info_repository: TABLE
   @@master_info_repository: TABLE
       @@relay_log_recovery: 1
1 row in set (0.00 sec)

Checking the replication status:

           Slave_IO_Running: Yes
            Slave_SQL_Running: Yes

Now, the test proposed on the Luis’ blog sometime ago to explain MTS is, on the master server:

mysql> create database db1; create database db2;
Query OK, 1 row affected (0.00 sec)

Query OK, 1 row affected (0.00 sec)

On slave side, check the content of the table mysql.slave_worker_info – this table will register all the movement around the MTS replication. Below you can see that, as we haven’t executed anything directly on databases yet, threads haven’t worked yet.

mysql> select * from mysql.slave_worker_info\G
*************************** 1. row ***************************
                        Id: 1
            Relay_log_name:
             Relay_log_pos: 0
           Master_log_name:
            Master_log_pos: 0
 Checkpoint_relay_log_name:
  Checkpoint_relay_log_pos: 0
Checkpoint_master_log_name:
 Checkpoint_master_log_pos: 0
          Checkpoint_seqno: 0
     Checkpoint_group_size: 64
   Checkpoint_group_bitmap:
*************************** 2. row ***************************
                        Id: 2
            Relay_log_name:
             Relay_log_pos: 0
           Master_log_name:
            Master_log_pos: 0
 Checkpoint_relay_log_name:
  Checkpoint_relay_log_pos: 0
Checkpoint_master_log_name:
 Checkpoint_master_log_pos: 0
          Checkpoint_seqno: 0
     Checkpoint_group_size: 64
   Checkpoint_group_bitmap:
2 rows in set (0.00 sec)

Coming back on the master, enter some inserts:

mysql> create table db1.t1(a int); create table db2.t1(a int);
Query OK, 0 rows affected (0.01 sec)

Query OK, 0 rows affected (0.00 sec)

mysql> insert into db1.t1 values (1),(2),(3); insert into db2.t1 values (1),(2),(3);
Query OK, 3 rows affected (0.00 sec)
Records: 3  Duplicates: 0  Warnings: 0

Query OK, 3 rows affected (0.00 sec)
Records: 3  Duplicates: 0  Warnings: 0

And then, we again go over mysql.slave_worker_info to check if those two listed threads have worked or not:

mysql> select * from mysql.slave_worker_info\G
*************************** 1. row ***************************
                        Id: 1
            Relay_log_name: ./mysqld-relay-bin.000002
             Relay_log_pos: 1171
           Master_log_name: master-bin.000001
            Master_log_pos: 1007
 Checkpoint_relay_log_name: ./mysqld-relay-bin.000002
  Checkpoint_relay_log_pos: 797
Checkpoint_master_log_name: master-bin.000001
 Checkpoint_master_log_pos: 633
          Checkpoint_seqno: 1
     Checkpoint_group_size: 64
   Checkpoint_group_bitmap:
*************************** 2. row ***************************
                        Id: 2
            Relay_log_name:
             Relay_log_pos: 0
           Master_log_name:
            Master_log_pos: 0
 Checkpoint_relay_log_name:
  Checkpoint_relay_log_pos: 0
Checkpoint_master_log_name:
 Checkpoint_master_log_pos: 0
          Checkpoint_seqno: 0
     Checkpoint_group_size: 64
   Checkpoint_group_bitmap:
2 rows in set (0.00 sec)

Just one thread working!! Yes, we confirmed that this does not work when you have a master on 5.5 and slaves on 5.6, regardless of the binlog_format and bla bla bla. A good point for a discussion at this point is that MySQL 5.6 has received lots of improvements regarding its engine, many other related with InnoDB and many others on many other things. Maybe it’s a good time to start upgrading 5.5 to 5.6 on slaves until we hit the master and then, upgrade all the database machines, even having MySQL 5.6 MTS disable for this moment.

Test Scenario: confirming that mysql 5.6 (master) and mysql 5.6 (slave) replicates with mts, even with binlog_format=statement

To make this new test, we just need to remove the 5.5’s RPM packages and add 5.6 from the repository and then, start slave. The final step is to execute the tests again and check the mysql.slave_worker_info table’s content on slave server.

[root@mysql55 ~]# service mysql stop
Shutting down MySQL. SUCCESS!
[root@mysql55 ~]# rpm -e MySQL-shared-5.5.39-2.el6.x86_64 MySQL-client-5.5.39-2.el6.x86_64 \
> MySQL-shared-compat-5.5.39-2.el6.x86_64 MySQL-server-5.5.39-2.el6.x86_64 \
> MySQL-shared-compat-5.5.39-2.el6.x86_64
[root@mysql55 ~]# yum -y install mysql-server
[...]
Setting up Install Process
[...]
Installed size: 329 M
Downloading Packages:
[...]
Complete!

With the 5.6 on master side, next step is to add to the my.cnf the thread_stack=256K to avoid this reported misconfiguration. After it, it time to put those two configured worker threads to work…

On master:

[root@mysql55 ~]# service mysqld start
Starting mysqld:                                           [  OK  ]
[root@mysql55 ~]# mysql -p
Enter password:
Welcome to the MySQL monitor.  Commands end with ; or \g.
Your MySQL connection id is 2
Server version: 5.6.21-log MySQL Community Server (GPL)

Copyright (c) 2000, 2014, Oracle and/or its affiliates. All rights reserved.

Oracle is a registered trademark of Oracle Corporation and/or its
affiliates. Other names may be trademarks of their respective
owners.

Type 'help;' or '\h' for help. Type '\c' to clear the current input statement.

mysql> insert into db1.t1 values (1),(2),(3); insert into db2.t1 values (1),(2),(3);
Query OK, 3 rows affected (0.01 sec)
Records: 3  Duplicates: 0  Warnings: 0

Query OK, 3 rows affected (0.00 sec)
Records: 3  Duplicates: 0  Warnings: 0

Checking the worker threads on slave:

mysql> select * from mysql.slave_worker_info\G
*************************** 1. row ***************************
                        Id: 1
            Relay_log_name: ./mysqld-relay-bin.000004
             Relay_log_pos: 976
           Master_log_name: master-bin.000002
            Master_log_pos: 816
 Checkpoint_relay_log_name: ./mysqld-relay-bin.000004
  Checkpoint_relay_log_pos: 554
Checkpoint_master_log_name: master-bin.000002
 Checkpoint_master_log_pos: 394
          Checkpoint_seqno: 1
     Checkpoint_group_size: 64
   Checkpoint_group_bitmap:
*************************** 2. row ***************************
                        Id: 2
            Relay_log_name: ./mysqld-relay-bin.000004
             Relay_log_pos: 765
           Master_log_name: master-bin.000002
            Master_log_pos: 605
 Checkpoint_relay_log_name: ./mysqld-relay-bin.000004
  Checkpoint_relay_log_pos: 554
Checkpoint_master_log_name: master-bin.000002
 Checkpoint_master_log_pos: 394
          Checkpoint_seqno: 0
     Checkpoint_group_size: 64
   Checkpoint_group_bitmap:
2 rows in set (0.00 sec)

Yes, it’s working and confirmed that MTS is a feature present just on 5.6, using ROW or STATEMENT as binlog_format. BTW, i like to blog things considering all the small details, because, as our MySQL friend said on MySQL Central @ OOW14, “do not underestimate the importance of the small things“.

All the best,

AddThis Social Bookmark Button

Fast Index Creation really matters

julho 23rd, 2014 | by: Bianchi | Posted in: MySQL A&D, MySQL Tuning | No Comments »

In one of the recent projects I’ve got involved, I had a situation where I started reviewing the data model so as to find any additional or unnecessary indexes on tables. The scenario is that one where the database was recently moved from MyISAM to InnoDB Storage Engine. So, considering that there are some critical queries that are hanging inside the InnoDB for a long time, I decided to remove some of the redundant indexes from some tables and then re-validate the queries with less indexes options in terms of optimization. To remove indexes, I had an option to do a simple ALTER TABLE … DROP INDEX and use pt-online-schema-change, this last gives a possibility to keep the operation running within the process of removing indexes. This is not a typical operation if we consider MySQL version prior to the 5.5 (or 5.1 + InnoDB Plugin), taking into account that the very first table thought to be a target of the ALTER TABLE was residing in a MySQL 5.0 (traumatic period) and the same table be one of the biggest tables that exists in the schema – 784GB. Now this table resides in the MySQL 5.5, but the MySQL 5.0’s trauma remains on the team members mind.

All the operation was executed very well in terms of the ALTER TABLE execution, it was faster and painless. Often, folks from the customer side wants to be comfortable with the solution about to be applied to avoid them to stay asleep at nights or weekends, I like that as well due to the audit process implied. Btw, the ALTER TABLE that dropped some indexes was executed on the MASTER server and was replicated to 10 slave servers and everything is running well. Avoid problems in modifying tables on slaves. At least on 5.5, I found a problem that was published at bugs.mysql.com and you can check that here (http://bugs.mysql.com/bug.php?id=60784).

So, all the comments done, the intention of this post is to demo the importance and how faster is to CREATE or DROP a secondary index on InnoDB tables and I wanna compare both versions, 5.0 and 5.5 and as I am planning to migrate all my customers to 5.6, I will provide soon tests considering this last one’s time as well.

Test Scenario

The very first thing to execute on this test to benchmark index creation and exclusion, we need to think of a table with large data and some complicate columns configured with complex data types such as large VARCHAR, TEXT and BLOB. It’s going to give us a complex scenario to deal with indexes on new and old MySQL versions. I would like to caught up your attention that, to add or remove secondary indexes on InnoDB tables from 5.1 + InnoDB Plugin/5.5, a table copy-alter-rename is not needed due to the Fast Index Creation, the opposite of what happens when it’s needed to alter a clustered index column. This is the focus of the tests here and the versions 5.0, 5.1, 5.5, and 5.6 will be part of this small benchmark. I’ve just raised a Vagrant VM with an automating script to setup all the MySQL versions as exhibited below:

[root@mysql56 ~]# find / -name mysqld
/mysql50/bin/mysqld
/mysql56/bin/mysqld
/mysql51/bin/mysqld
/mysql55/bin/mysqld

[root@mysql56 ~]# ls -lh / | grep mysql
drwxr-xr-x  15 mysql   mysql   4.0K May 31 01:12 mysql50
drwxr-xr-x  13 mysql   mysql   4.0K May 31 00:35 mysql51
drwxr-xr-x  13 mysql   mysql   4.0K May 31 01:15 mysql55
drwxr-xr-x  13 mysql   mysql   4.0K May 31 00:16 mysql56

[root@mysql56 bin]# /etc/init.d/mysql50 status
MySQL is not running                                       [FAILED]
[root@mysql56 bin]# /etc/init.d/mysql51 status
MySQL is not running, but PID file exists                  [FAILED]
[root@mysql56 bin]# /etc/init.d/mysql55 status
MySQL is not running, but PID file exists                  [FAILED]
[root@mysql56 bin]# /etc/init.d/mysql56 status
MySQL is not running, but PID file exists                  [FAILED]

[root@mysql56 ~]# df -h
Filesystem            Size  Used Avail Use% Mounted on
/dev/mapper/VolGroup00-LogVol00
                      7.7G  7.3G     0 100% /
/dev/sda1              99M   20M   75M  21% /boot
tmpfs                 502M     0  502M   0% /dev/shm
/dev/sdb1             7.9G  147M  7.4G   2% /mysql50/datadir
/dev/sdc1             7.9G  147M  7.4G   2% /mysql51/datadir
/dev/sdd1             7.9G  147M  7.4G   2% /mysql55/datadir
/dev/sde1             7.9G  147M  7.4G   2% /mysql56/datadir

1. Create a complex test table and a stored procedure to populate the table:

I’m not sure if this below table is complex enough if we compare this with that large table that we can encounter on company’s databases. Generally, when tables are target of INSERTs, DELETEs and UPDATEs, it’s needed to consider some other factors which the main ones are data fragmentation due to the random access to InnoDB pages and a lack of accuracy related with table statistics – both aspects can be solved with OPTIMIZE TABLE. BTW, the time can be close to that one that will be available here on tests. Let’s create the table and the procedure which will load data in the table.

#
#: creating the database and a table to 
#: accommodate data for the tests
#
mysql> CREATE DATABASE wb;
Query OK, 1 row affected (0.00 sec)

mysql> CREATE TABLE wb.tbl01 (
    -> a bigint not null auto_increment primary key,
    -> b varchar(144) not null,
    -> c char(144) not null,
    -> d longblob,
    -> e longtext
    -> ) ENGINE=InnoDB;
Query OK, 0 rows affected (1.68 sec)
#
#: stored procedure to load data in the table
#
mysql> DELIMITER //
mysql> CREATE PROCEDURE wb.proc01(IN p_num BIGINT)
 -> BEGIN
 -> SET @u_var = 0;
 -> WHILE @u_var <= p_num DO
 -> INSERT INTO wb.tbl01
 -> SET a=@u_var,
 -> b=REPEAT(CONCAT(DATE_FORMAT(NOW(),'%d%m%Y%h%m%s'),md5(@u_var)),1),
 -> c=REPEAT(CONCAT(DATE_FORMAT(NOW(),'%d%m%Y%h%m%s'),md5(@u_var)),1),
 -> d=REPEAT(CONCAT(DATE_FORMAT(NOW(),'%d%m%Y%h%m%s'),md5(@u_var)),2),
 -> e=REPEAT(CONCAT(DATE_FORMAT(NOW(),'%d%m%Y%h%m%s'),md5(@u_var)),2);
 -> SET @u_var = @u_var+1;
 -> END WHILE;
 -> END //
Query OK, 0 rows affected (0.00 sec)</pre>

#
#: this is the resultant data after running the procedure above
#
mysql> select * from wb.tbl01 limit 10\G
*************************** 1. row ***************************
a: 1
b: 23072014070734c4ca4238a0b923820dcc509a6f75849b
c: 23072014070734c4ca4238a0b923820dcc509a6f75849b
d: 23072014070734c4ca4238a0b923820dcc509a6f75849b23072014070734c4ca4238a0b923820dcc509a6f75849b
e: 23072014070734c4ca4238a0b923820dcc509a6f75849b23072014070734c4ca4238a0b923820dcc509a6f75849b
*************************** 2. row ***************************
a: 2
b: 23072014070734c81e728d9d4c2f636f067f89cc14862c
c: 23072014070734c81e728d9d4c2f636f067f89cc14862c
d: 23072014070734c81e728d9d4c2f636f067f89cc14862c23072014070734c81e728d9d4c2f636f067f89cc14862c
e: 23072014070734c81e728d9d4c2f636f067f89cc14862c23072014070734c81e728d9d4c2f636f067f89cc14862c
*************************** 3. row ***************************
a: 3
b: 23072014070734eccbc87e4b5ce2fe28308fd9f2a7baf3
c: 23072014070734eccbc87e4b5ce2fe28308fd9f2a7baf3
d: 23072014070734eccbc87e4b5ce2fe28308fd9f2a7baf323072014070734eccbc87e4b5ce2fe28308fd9f2a7baf3
e: 23072014070734eccbc87e4b5ce2fe28308fd9f2a7baf323072014070734eccbc87e4b5ce2fe28308fd9f2a7baf3
*************************** 4. row ***************************
a: 4
b: 23072014070734a87ff679a2f3e71d9181a67b7542122c
c: 23072014070734a87ff679a2f3e71d9181a67b7542122c
d: 23072014070734a87ff679a2f3e71d9181a67b7542122c23072014070734a87ff679a2f3e71d9181a67b7542122c
e: 23072014070734a87ff679a2f3e71d9181a67b7542122c23072014070734a87ff679a2f3e71d9181a67b7542122c
*************************** 5. row ***************************
a: 5
b: 23072014070734e4da3b7fbbce2345d7772b0674a318d5
c: 23072014070734e4da3b7fbbce2345d7772b0674a318d5
d: 23072014070734e4da3b7fbbce2345d7772b0674a318d523072014070734e4da3b7fbbce2345d7772b0674a318d5
e: 23072014070734e4da3b7fbbce2345d7772b0674a318d523072014070734e4da3b7fbbce2345d7772b0674a318d5
*************************** 6. row ***************************
a: 6
b: 230720140707341679091c5a880faf6fb5e6087eb1b2dc
c: 230720140707341679091c5a880faf6fb5e6087eb1b2dc
d: 230720140707341679091c5a880faf6fb5e6087eb1b2dc230720140707341679091c5a880faf6fb5e6087eb1b2dc
e: 230720140707341679091c5a880faf6fb5e6087eb1b2dc230720140707341679091c5a880faf6fb5e6087eb1b2dc
*************************** 7. row ***************************
a: 7
b: 230720140707348f14e45fceea167a5a36dedd4bea2543
c: 230720140707348f14e45fceea167a5a36dedd4bea2543
d: 230720140707348f14e45fceea167a5a36dedd4bea2543230720140707348f14e45fceea167a5a36dedd4bea2543
e: 230720140707348f14e45fceea167a5a36dedd4bea2543230720140707348f14e45fceea167a5a36dedd4bea2543
*************************** 8. row ***************************
a: 8
b: 23072014070734c9f0f895fb98ab9159f51fd0297e236d
c: 23072014070734c9f0f895fb98ab9159f51fd0297e236d
d: 23072014070734c9f0f895fb98ab9159f51fd0297e236d23072014070734c9f0f895fb98ab9159f51fd0297e236d
e: 23072014070734c9f0f895fb98ab9159f51fd0297e236d23072014070734c9f0f895fb98ab9159f51fd0297e236d
*************************** 9. row ***************************
a: 9
b: 2307201407073445c48cce2e2d7fbdea1afc51c7c6ad26
c: 2307201407073445c48cce2e2d7fbdea1afc51c7c6ad26
d: 2307201407073445c48cce2e2d7fbdea1afc51c7c6ad262307201407073445c48cce2e2d7fbdea1afc51c7c6ad26
e: 2307201407073445c48cce2e2d7fbdea1afc51c7c6ad262307201407073445c48cce2e2d7fbdea1afc51c7c6ad26
*************************** 10. row ***************************
a: 10
b: 23072014070734d3d9446802a44259755d38e6d163e820
c: 23072014070734d3d9446802a44259755d38e6d163e820
d: 23072014070734d3d9446802a44259755d38e6d163e82023072014070734d3d9446802a44259755d38e6d163e820
e: 23072014070734d3d9446802a44259755d38e6d163e82023072014070734d3d9446802a44259755d38e6d163e820
10 rows in set (0.00 sec)

After setting up the database, table and the stored procedure, start the procedure to load data into the table we’ll be using to benchmark fast index creation and drop among MySQL versions.

mysql> call wb.proc01(1000000);
Query OK, 0 rows affected (7 min 31.18 sec)

mysql> select count(*) from wb.tbl01;
+----------+
| count(*) |
+----------+
|  1000000 |
+----------+
1 row in set (1.72 sec)

2. Create some secondary indexes:

Let’s use the column c as the column to be indexed creating an index called i.

##############################################
#
#: creating a secondary index on MySQL 5.0
#: Server version: 5.0.91 MySQL Community Server (GPL)
#
mysql> alter table wb.tbl01 add index i (c);
Query OK, 1000000 rows affected (7 min 33.84 sec)
Records: 1000000  Duplicates: 0  Warnings: 0

#
#: dropping a secondary index on MySQL 5.0
#
mysql> alter table wb.tbl01 drop index i;
Query OK, 1000000 rows affected (5 min 8.14 sec)
Records: 1000000  Duplicates: 0  Warnings: 0

Just registering here that when I started the same procedure to create objects on MySQL 5.1, I found this error message when calling the procedure:

ERROR 1436 (HY000): Thread stack overrun:  8264 bytes used of a 131072 byte stack, and 128000 bytes needed.  Use 'mysqld -O thread_stack=#' to specify a bigger stack.

I adjusted the environment variable thread_stack to 192K (it’s max value) and restarted mysqld.

##############################################
#
#: creating a secondary index on MySQL 5.1.70
#: Server version: 5.1.70 MySQL Community Server (GPL)
#
mysql> alter table wb.tbl01 add index i (c);
Query OK, 1000000 rows affected (7 min 10.73 sec)
Records: 1000000  Duplicates: 0  Warnings: 0

#
#: dropping a secondary index on MySQL 5.1.70
#
mysql> alter table wb.tbl01 drop index i;
Query OK, 1000000 rows affected (5 min 12.24 sec)
Records: 1000000  Duplicates: 0  Warnings: 0
##############################################
#
#: creating a secondary index on MySQL 5.5.33
#: Server version: 5.5.33 MySQL Community Server (GPL)
#
mysql> alter table wb.tbl01 add index i (c);
Query OK, 0 rows affected (1 min 21.68 sec)
Records: 0  Duplicates: 0  Warnings: 0

#
#: dropping a secondary index on MySQL 5.5.33
#
mysql> alter table wb.tbl01 drop index i;
Query OK, 0 rows affected (0.46 sec)
Records: 0  Duplicates: 0  Warnings: 0

###############################################
#: creating a secondary index on MySQL 5.6.17
#: Server version: 5.6.17 MySQL Community Server (GPL)
#
mysql> alter table wb.tbl01 add index i (c);
Query OK, 0 rows affected (1 min 39.08 sec)
Records: 0  Duplicates: 0  Warnings: 0

#
#: dropping a secondary index on MySQL 5.6.17
#
mysql> alter table wb.tbl01 drop index i;
Query OK, 0 rows affected (0.42 sec)
Records: 0  Duplicates: 0  Warnings: 0

The tests conclusion is that new versions have improved along the time and Fast Index Creation really matters when one is taking with secondary indexes. It enforces the concept of the logic/strategy behind InnoDB that uses Primary Key lookups and then, you must have a PK on all the tables – if you don’t state one, InnoDB will elect one of the columns to a PK or will internally create a ROWID column. Secondary indexes can be changed anytime with faster response from the MySQL, making it easier to add/remove in many cases (imagine you’re working to redesign the database model in terms of indexes).

Another point to expose here is that the on disk data is smaller on newer versions. 5.0 and 5.1 had the same behavior regarding the data size on disk, but, on 5.5 and 5.6 the same amount of data reflected a different global size:

[root@mysql56 mysql56]# df -lh
Filesystem            Size  Used Avail Use% Mounted on
/dev/sda1              99M   20M   75M  21% /boot
tmpfs                 502M     0  502M   0% /dev/shm
/dev/sdb1             7.9G  1.3G  6.3G  17% /mysql50/datadir
/dev/sdc1             7.9G  1.3G  6.3G  17% /mysql51/datadir
/dev/sdd1             7.9G  744M  6.8G  10% /mysql55/datadir
/dev/sde1             7.9G  874M  6.7G  12% /mysql56/datadir

Index Creation

BLOG_INDEX_CREATION

Dropping Index

BLOG_INDEX_DROPPING

AddThis Social Bookmark Button

How to change the number or size of InnoDB Log Files

fevereiro 27th, 2014 | by: Bianchi | Posted in: MySQL A&D | No Comments »

This week I was approached by a friend who was not aware of the resource available in 5.6 although it’s being very well commented and has been used by many that received that as a very good new feature. In fact, it was a bit intrusive to change transaction log sizes and the # of files when using old versions of MySQL; this is something that sometimes was able to put someone else at risk.

With the 5.6++ that operation became simple since it will resize and create new files automatically after detect new configurations related to the redo/transaction logs files and one doesn’t need to move files anymore, as was done using prior 5.6 versions. From now on, one will just need to change configuration dynamically/using configuration file and restart mysqld.

On 5.6 it’s just a matter of adjust innodb system variables globally, in case of innodb_fast_shutdown to sync log buffer and log files, edit my.cnf to add or update the values of the system variables that handle transaction log behaviour and then, give mysql a restart. I’ve got some log output of all the action that are involved in doing that.

Below you’ll be able to check that innodb_fast_shutdown was configured to make mysqld sync all the buffer content with disk files and then, shutdown. This is the moment in which the adjusts on system variables innodb related was done. When mysqld was started, it read the new configurations and adjusted sizes and the # of transaction logs files.

[root@localhost ~]# mysql -p
Enter password:
Welcome to the MySQL monitor.  Commands end with ; or \g.
Your MySQL connection id is 2
Server version: 5.6.15-log MySQL Community Server (GPL)

Copyright (c) 2000, 2013, Oracle and/or its affiliates. All rights reserved.

Oracle is a registered trademark of Oracle Corporation and/or its
affiliates. Other names may be trademarks of their respective
owners.

Type 'help;' or '\h' for help. Type '\c' to clear the current input statement.

mysql> show variables like 'innodb_log_%';
+-----------------------------+----------+
| Variable_name               | Value    |
+-----------------------------+----------+
| innodb_log_file_size        | 50331648 |
| innodb_log_files_in_group   | 2        |
| innodb_log_group_home_dir   | ./       |
+-----------------------------+----------+
5 rows in set (0.00 sec)

mysql> set global innodb_fast_shutdown=1;
Query OK, 0 rows affected (0.01 sec)

# stopped mysql
# edited configuration file
[mysqld]
innodb_log_file_size=16M
innodb_log_files_in_group=4

# mysqld restart
[root@localhost ~]# /etc/init.d/mysql restart
Shutting down MySQL.. SUCCESS!
Starting MySQL... SUCCESS!

# logs and auto adjust of files
[root@localhost ~]# tail -f /var/lib/mysql/localhost.localdomain.err
2014-02-27 07:10:29 2266 [Note] InnoDB: 128 rollback segment(s) are active.
2014-02-27 07:10:29 2266 [Note] InnoDB: Waiting for purge to start
2014-02-27 07:10:29 2266 [Note] InnoDB: 5.6.15 started; log sequence number 1828674
2014-02-27 07:10:30 2266 [Note] Server hostname (bind-address): '*'; port: 3306
2014-02-27 07:10:30 2266 [Note] IPv6 is available.
2014-02-27 07:10:30 2266 [Note]   - '::' resolves to '::';
2014-02-27 07:10:30 2266 [Note] Server socket created on IP: '::'.
2014-02-27 07:10:30 2266 [Note] Event Scheduler: Loaded 0 events
2014-02-27 07:10:30 2266 [Note] /usr/sbin/mysqld: ready for connections.
Version: '5.6.15-log'  socket: '/var/lib/mysql/mysql.sock'  port: 3306  MySQL Community Server (GPL)
2014-02-27 07:11:29 2266 [Note] /usr/sbin/mysqld: Normal shutdown

[...]

2014-02-27 07:11:30 2266 [Note] Shutting down plugin 'binlog'
2014-02-27 07:11:30 2266 [Note] /usr/sbin/mysqld: Shutdown complete

140227 07:11:30 mysqld_safe mysqld from pid file /var/lib/mysql/localhost.localdomain.pid ended
140227 07:11:31 mysqld_safe Starting mysqld daemon with databases from /var/lib/mysql
2014-02-27 07:11:31 0 [Warning] TIMESTAMP with implicit DEFAULT value is deprecated. Please use --explicit_defaults_for_timestamp server option (see documentation for more details).
2014-02-27 07:11:31 2488 [Warning] No argument was provided to --log-bin, and --log-bin-index was not used; so replication may break when this MySQL server acts as a master and has his hostname changed!! Please use '--log-bin=localhost-bin' to avoid this problem.
2014-02-27 07:11:31 2488 [Note] Plugin 'FEDERATED' is disabled.
2014-02-27 07:11:32 2488 [Note] InnoDB: Completed initialization of buffer pool
2014-02-27 07:11:32 2488 [Note] InnoDB: Highest supported file format is Barracuda.
2014-02-27 07:11:32 2488 [Warning] InnoDB: Resizing redo log from 2*3072 to 4*1024 pages, LSN=1828684
2014-02-27 07:11:32 2488 [Warning] InnoDB: Starting to delete and rewrite log files.
2014-02-27 07:11:32 2488 [Note] InnoDB: Setting log file ./ib_logfile101 size to 16 MB
2014-02-27 07:11:32 2488 [Note] InnoDB: Setting log file ./ib_logfile1 size to 16 MB
2014-02-27 07:11:33 2488 [Note] InnoDB: Setting log file ./ib_logfile2 size to 16 MB
2014-02-27 07:11:33 2488 [Note] InnoDB: Setting log file ./ib_logfile3 size to 16 MB
2014-02-27 07:11:33 2488 [Note] InnoDB: Renaming log file ./ib_logfile101 to ./ib_logfile0
2014-02-27 07:11:33 2488 [Warning] InnoDB: New log files created, LSN=1828684
2014-02-27 07:11:33 2488 [Note] InnoDB: 128 rollback segment(s) are active.
2014-02-27 07:11:33 2488 [Note] InnoDB: Waiting for purge to start
2014-02-27 07:11:33 2488 [Note] InnoDB: 5.6.15 started; log sequence number 1828684
2014-02-27 07:11:33 2488 [Note] Server hostname (bind-address): '*'; port: 3306
2014-02-27 07:11:33 2488 [Note] IPv6 is available.
2014-02-27 07:11:33 2488 [Note]   - '::' resolves to '::';
2014-02-27 07:11:33 2488 [Note] Server socket created on IP: '::'.
2014-02-27 07:11:33 2488 [Note] Event Scheduler: Loaded 0 events
2014-02-27 07:11:33 2488 [Note] /usr/sbin/mysqld: ready for connections.
Version: '5.6.15-log'  socket: '/var/lib/mysql/mysql.sock'  port: 3306  MySQL Community Server (GPL)
[...]

# checking system variables again
mysql> show variables like 'innodb_log%';
+-----------------------------+----------+
| Variable_name               | Value    |
+-----------------------------+----------+
| innodb_log_buffer_size      | 8388608  |
| innodb_log_compressed_pages | ON       |
| innodb_log_file_size        | 16777216 |
| innodb_log_files_in_group   | 4        |
| innodb_log_group_home_dir   | ./       |
+------------------------

More information about you can find clicking the link below:
http://dev.mysql.com/doc/refman/5.6/en/innodb-data-log-reconfiguration.html

I hope that help!

AddThis Social Bookmark Button

Replication and worker threads

janeiro 30th, 2014 | by: Bianchi | Posted in: MySQL Replication | No Comments »

Recently I’ve got myself a little worried about how to monitor the threads executing data coming from the relay logs in a replication environment. I decided to go, raise some virtual machines, setup mysql on that and start investigating how to do that. All the things will start setting up the replication between some mysql servers using binary log. I haven’t tested the slave parallel workers with GTID replication and hearing folks around saying that parallel slave workers is a feature that is note working in GTID at this time (check the blog’s date, ok?)

Getting those stuff running, this is time to configure the slave_parallel_workers, which is the system variable that is in changer to control/handle the amount of threads will be dedicated to execute all those data being piled in relay logs. BTW, it’s very good that the mentioned variable as many others can be reconfigured with new value on the runtime and having said that…

mysql> show variables like ‘slave_parallel%’;
+——————————+———————–+
| Variable_name | Value |
+——————————+———————–+
| slave_parallel_workers | 0 |
+——————————+———————–+
1 rows in set (0.00 sec)

mysql> set global slave_parallel_workers=10;
Query OK, 0 rows affected (0.00 sec)

mysql> show variables like ‘slave_parallel%’;
+——————————+———————–+
| Variable_name | Value |
+——————————+———————–+
| slave_parallel_workers | 10 |
+——————————+———————–+
1 rows in set (0.00 sec)

As you can see, it’s easy to configure the number of threads the will execute data that is coming form the relay log/master server. It’s good to have in mind that is advisable that the number of threads keep up with the number of the available processor cores of the slave machine, as this is the slave one. This is the time so to configure a way to monitor the slave thread worker. Another variable that has a GLOBAL scope as well must be reconfigured:

# assure that the replication is stopped at this point as it’s just possible to run the below command if replication is stopped

mysql> set global relay_log_info_repository=’table’;
ERROR 1198 (HY000): This operation cannot be performed with a running slave; run STOP SLAVE first
mysql> stop slave;
Query OK, 0 rows affected (0.01 sec)

mysql> set global relay_log_info_repository=’table’;
Query OK, 0 rows affected (0.02 sec)

mysql> start slave;
Query OK, 0 rows affected, 1 warning (0.03 sec)

Now it’s a matter to start slave and query the mysql.slave_worker_info table…

mysql> select count(*) from mysql.slave_worker_info\G
*************************** 1. row ***************************
count(*): 10
1 row in set (0.00 sec)

Cheers, WB


AddThis Social Bookmark Button

Lock wait timeout exceeded; try restarting transaction

dezembro 26th, 2013 | by: Bianchi | Posted in: MySQL A&D, MySQL Manutenção | No Comments »

It’s very nice when you find some very good and well explained messages in the MySQL error log and the ENGINE INNODB STATUS output. The very good part of the story is to know where you must go to check problems regarding some resources. This is not from today that we’ve seen many messages regarding transaction deadlocks and the connection that is lost in midst of a query execution. This time I used some extra time to execute some tests in order to force MySQL to server me an error explicitly in the mysql client.

As we know, InnoDB is the MySQL’s transactional engine and every transaction has its isolation level well configured by the database administrator or, as happens in the majority of time, the default or standard REPEATABLE READ is used. As the isolation level is beyond this post focus, I’d like to focus the error message around the deadlocks.

Just to put that on the records and give few hints to solve the transaction timeout problem, I played around with the innodb_lock_wait_timeout environment variable which has as a default value 50 seconds; this is the time another transaction will wait to acquire a lock on certain resource,currently locked by another transaction. Imagine a line, if someone is buying a ticket for the show, you must wait that person to finish the buying transaction. But, considering databases, if you’re the second transaction you’ll wait just for innodb_lock_wait_timeout seconds!

Let’s play with that…(I will keep it simple, just to play around…)

mysql> create table test.t1(id int);
Query OK, 0 rows affected (0.10 sec)

mysql> insert into test.t1 set id=1;
Query OK, 1 row affected (0.01 sec)

On terminal A, I started a transaction that will automatically set autocommit to 0, which needs an explicit commit or rollback. My intention here is to lock a resource that is the table test.t1 previously created.

mysql> start transaction;
Query OK, 0 rows affected (0.00 sec)

mysql> update test.t1 set id=1;
Query OK, 2 rows affected (0.00 sec)
Rows matched: 2 Changed: 2 Warnings: 0

On terminal B, I firstly configured innodb_lock_wait_timeout with 1 as its value and then…

mysql> set innodb_lock_wait_timeout=1;
Query OK, 0 rows affected (0.01 sec)

mysql> select @@innodb_lock_wait_timeout;
+----------------------------+
| @@innodb_lock_wait_timeout |
+----------------------------+
|                          1 |
+----------------------------+
1 row in set (0.00 sec)

mysql> insert into test.t1 set id=3;
ERROR 1205 (HY000): Lock wait timeout exceeded; try restarting transaction

This is a typical scenario where deadlocks are happening all the time and it can generate some important performance issues. Before to increase the time innodb_lock_wait_timeout it’s better to check the queries or transactions started by the application so as to fix logic problems. Remember that triggers can be the reason of some problems as this resource will be part of the current transaction as well.

So, just to finish this kidding time, I configured innodb_lock_wait_timeout considering terminal A and B mentioned scenario just to check what ENGINE INNODB STATUS shows up:

------------
TRANSACTIONS
------------
Trx id counter 1826
Purge done for trx's n:o &lt; 1822 undo n:o &lt; 0 state: running but idle
History list length 6
LIST OF TRANSACTIONS FOR EACH SESSION:
---TRANSACTION 0, not started
MySQL thread id 7, OS thread handle 0x7f50f05dd700, query id 58 localhost root init
show engine innodb status
---TRANSACTION 1825, ACTIVE 18 sec inserting
mysql tables in use 1, locked 1
LOCK WAIT 2 lock struct(s), heap size 376, 1 row lock(s)
MySQL thread id 5, OS thread handle 0x7f50f061e700, query id 56 localhost root update
insert into test.t1 set id=3
------- TRX HAS BEEN WAITING 18 SEC FOR THIS LOCK TO BE GRANTED:
RECORD LOCKS space id 6 page no 3 n bits 72 index `GEN_CLUST_INDEX` of table `test`.`t1` trx id 1825 lock_mode X insert intention waiting
Record lock, heap no 1 PHYSICAL RECORD: n_fields 1; compact format; info bits 0
0: len 8; hex 73757072656d756d; asc supremum;;

A good advice here in case you’re facing issues like this is to develop to your apps connecting to MySQL a structured code using try/catch to raise the exception which is the transaction that died after waiting to acquire a lock in order to re-execute and not lose data at the end. If you’re seeing errors like these around, make sure to address that asap to avoid data inconsistencies on your databases. The same can happen as well on the replication slave side, which can break the replication by almost the same error in case you have different values for innodb_lock_wait_timeout configured for master and slaves.

Have you played around with some InnoDB variable and got some simple scenario?

Cheers!!

AddThis Social Bookmark Button

MySQL 5.5.X – Sort aborted

dezembro 26th, 2013 | by: Bianchi | Posted in: MySQL A&D, MySQL Manutenção, MySQL Tuning | No Comments »

This morning I started investigating a file sort problem that is happening with a report server. Actually, what caught more my attention was what is really behind of the error message that is appearing many time along MySQL report server’s error log. Yes, this particular server is a slave server used just for extract reports on business data and because that, this kind if server generally is prepared to have good response to read queries which use aggregations COUNT(), SUM(), AVG() and consequently group data by some spacial column. BTW, all the data will be more in memory than on disk and all that story.

But, what is behind the message “[Warning] Sort aborted, host:” ? So, researching for the same case on the internet, I found that some of the problems reported by MySQL on log_error is around these possibilites:

Insufficient disk space in tmpdir prevented tmpfile from being created

This one is easier to check, just df -h /tmp will give you the notice about all the avail space you have at this point at the temporary dir. So, a good question here is, what do I research for when get the notice that there is enough space in /tmp dir? This is the time to get the query what is causing the issue and re execute it, monitoring the /tmp dir and checking if it’s getting full.

Somebody ran KILL in the middle of a filesort

At this point, I agree with Suresh Kuna when he said that “as a DBA, we can’t do much with the first point apart from informing customer to check at the application side for connection drop outs”. The query can be stopped by a error reading packages, a transactions timeout or even a replication slave timeout. Many variables get involved when analysing this kind of problem, but, mainly, problems regarding a user that give up the report’s query in the processing midst.

The server was shutdown while some queries were sorting

When the error is reported to the error log, probably you have an opportunity to observe the timestamp associated with that and then, go through the details on MySQL Server shutdown reading along the error log entries.

A transaction got rolled back or aborted due to lock wait timeout or deadlock

At this point we can consider many things but the main ones are the checking of ENGINE INNODB STATUS which will report all the deadlocks in case you’re using InnoDB to handle database tables or even the log_error that will report message errors regrading occurred deadlocks with local server transaction or if the local server act as a slave, the slave, the message can report that the deadlock is happening with a replicated transaction – innodb_lock_wait_timeout and slave_net_timeout can help with this. Another variables that can be used is slave_transaction_retries which reports if a replication slave SQL thread fails to execute a transaction because of an InnoDB deadlock or because the transaction’s execution time exceeded InnoDB’s innodb_lock_wait_timeout.

Unexpected errors, such as source table or even tmp table was corrupt.

In this case, depending on the size of the involved table (sometimes you won’t be able to know what is the target table just reading the log_error), a simple CHECK TABLE can be effective in get to know if the table has corrupted pages or another errors.

Processing of a subquery failed which was also sorting

This is a classic case in majority of times. The good news is that when a subquery fails to be sorted out it’s a good case to review the value configured to sort_buffer_size. TAKE CARE, do not increase it without checking the reason and the * status variables to study what is the best value to fit the server’s requirements in file sorting process.

Considering what is explained on the online MySQL manual, just increase the sort_buffer_size value when the Sort_merge_passes is greater then zero.

Sheri Cabral wrote about that: http://www.pythian.com/blog/sort_buffer_size-and-knowing-why/

AddThis Social Bookmark Button

MySQL e o skip-name-resolve

novembro 28th, 2013 | by: Bianchi | Posted in: MySQL Tuning | No Comments »

Desde o lançamento da versão 5.5 do servidor de bancos de dados MySQL que eu venho verificando muitos problemas relacionados com a variável de resolução de nomes, skip-name-resolve. Para quem ainda não sabe ou está iniciando com o MySQL, toda vez que o servidor de bancos de dados recebe uma consulta, como por exemplo, aquela vinda do mysql client, o host de onde vem esta conexão é parte da verificação de autenticação do usuário. Além do nome de usuário e a senha, o usuário deverá ter permissão de originar uma conexão de um determinado host, assim configurado através da criação explícita do usuário através do comando CREATE USER, ou, dependendo das configuração de SQL_MODE, usuários podem ser criados diretamente através do comando GRANT, este que permite que você também dê as devidas permissões e configure host e senha para o usuário.

Voltando então ao momento da conexão, considerando que o host é também verificado, na versão 5.5 uma nova feature foi apresentada, sendo adicionada para que hosts passassem permanecer em memória cache. Não só isso, como o MySQL verifica a existência do host vinculado a uma conexão através da coluna host da tabela mysql.user, quando um host não existe, o MySQL tenta resolver o host através de um DNS Lookup. Primeiro ele resolve o IP em um nome de host e assim ele continua utilizando o IP, mas guarda no cache no cache o nome do host. Na resolução do IP em nome, existe uma verificação adicional: verificar se o IP que chegou no MySQL é o mesmo IP configurado por trás do nome da máquina configurado no DNS. Parece muito bom, mas, se na sua empresa você não utiliza um DNS ou mesmo, só tem endereços de IP na coluna hosts da tabela mysql.user, talvez não seja necessário gerar um overhead para o servidor e também, um pouco de dor de cabeça, pois, dependendo do tipo de monitoramento que você tem internamente, uma simples linha de um IP esse ou aquele adicionada ao error log, pode disparar um chamado desnecessário no meio da noite – olha, isso acontece!!

Vantagens e desvantagens, se é necessário que um usuário se conecte do endereço BOX01 onde um dos requisitos é criar um usuário “foo”@”box01”, tudo bem, vale ter a configuração. um outro ponto bastante interessante é configurar o MySQL para que, caso um determinado usuário tentar conexão por x vezes e não conseguir se logar no MySQL por conta de digitação errada ou mesmo esquecimento da senha, ele pode ser bloqueado (ninguém sabe quando é uma pessoa ou um robô tentando acesso). Isso poderá ser realizado através da variável max_connect_errors, que adicionada ao arquivo de configuração, com um valor 3, por exemplo, dará 3 oportunidades de tentativa de login. Para desbloquear os hosts bloqueados, FLUSH HOSTS.

Com a opção habilitada, o MySQL, além de fazer essa verificação de IP (se ele é ele mesmo!!), ainda será utilizado um mecanismo de memória para adicionar ao cache os hosts logo no primeiro acesso válido, sendo estes hosts mantidos em memória até o espaço para esta lista de hosts se esgotar. Nesse momento, o algoritmo LRU (Least Recently Used) é acionado o host menos acessado é despejado da memória (processo conhecido como eviction).  Todo esse processo também envolve estruturas como mutexesthreads e locks.

Agora, caso os usuários que utilizam o MySQL possam ser criados considerando o IP de onde a conexão é gerada ou a string localhost, podemos desabilitar a resolução de nomes com a variável –skip-name-resolve, adicionada à sessão [mysqld] do arquivo de configuração do MySQL e reinicie o mysqld.

[mysqld]
max_connect_errors=3 # três tentativas de autenticação
#skip-name-resolve   # desabilita o DNS Lookup, linha comentada

Interessante ressaltar que caso seja encontrado na coluna host das tabelas privilégio (user, db, host, tables_priv, columns_priv e procs_priv) um valor diferente de um IP ou a string localhost, não é aconselhável que a resolução de nomes seja habilitada. Caso contrário, caso exista somente IPs e a string localhost, –skip-name-resolve poderá ser desabilitado. use a consulta abaixo para verificar a existência de possíveis valores na coluna host nas tabelas de privilégios do MySQL (também conhecidas como grant tables):

mysql> select a.host as `mysql.user`, b.host as `mysql.db`, c.host as `mysql.tables_priv`, d.host as `mysql.columns_pric` FROM mysql.user as a left join mysql.db as b on a.user=b.user left join mysql.tables_priv as c on a.user=c.user left join mysql.columns_priv as d on a.user=d.user;
+-----------------------+----------+-------------------+--------------------+
| mysql.user            | mysql.db | mysql.tables_priv | mysql.columns_pric |
+-----------------------+----------+-------------------+--------------------+
| localhost             | %        | NULL              | NULL               |
| localhost.localdomain | %        | NULL              | NULL               |
| localhost             | %        | NULL              | NULL               |
| localhost.localdomain | %        | NULL              | NULL               |
| 127.0.0.1             | NULL     | NULL              | NULL               |
| ::1                   | NULL     | NULL              | NULL               |
| localhost             | NULL     | NULL              | NULL               |
| localhost             | NULL     | NULL              | NULL               |
| localhost.localdomain | NULL     | NULL              | NULL               |
+-----------------------+----------+-------------------+--------------------+
9 rows in set (0.01 sec)

No resultado da consulta acima, perceba que há muitos valores NULL em tabelas mais à direita. Esse comportamento denota que não há usuários com permissões em de acesso restrito somente à bancos de dados, à tabelas de bancos de dados ou somente à colunas de determinadas tabelas de bancos de dados específicos.

Quando o recurso está habilitado e o MySQL não consegue fazer o lookup reverso de conexões, um evento de Warning é adicionado ao log de erro – verifique a variável error_log para saber aonde o arquivo de log foi criado – onde é descrito que não foi possível resolver determinado IP/DNS de uma conexão. O erro que será adicionado ao arquivo de log de erro do MySQL é algo como a linha abaixo:

[Warning] IP address '#.#.#.#' could not be resolved: Name or service not known

Interessante saber exatamente o que cada evento adicionado ao log de erros do MySQL representa para que seu sistema continue rodando sem problemas de downtime e ter a possibilidade de ser mais proativo com os possíveis problemas que o MySQL e os seus bancos de dados possam apresentar no futuro.

Esse foi um post curto, mais teórico que prático, mas, a boa notícia e que vou tentar voltar em breve!!

Happy MySQL’ing!!

AddThis Social Bookmark Button

InnoDB Status Output – Buffer Pool and Spin Rounds

outubro 19th, 2013 | by: Bianchi | Posted in: MySQL Tuning | No Comments »

InnoDB has a good source of information about its status which can be requested every time you need to know “what’s up” with that in your environment. The SHOW ENGINE INNODB STATUS will inform you the last x seconds of its operation, leveraging system or database administrator with the best – as possible – position about what is happening with data pages which are being manipulated in a sense of maintain those in the Buffer Pool as more as possible.

$ mysql -u  -p -e 'SHOW ENGINE INNODB STATUS\G' > file

Buffer Pool is the privileged main memory area where InnoDB will maintain all the last recently used data pages, regardless of the page’s size, in rotation, based on LRU algorithm. This area will serve well for SELECT, UPDATE and DELETE, SQL commands which will use more data from memory than that on disk. Pages will be cycling between young and old status, more used and less used, respectively…

----------------------
BUFFER POOL AND MEMORY
----------------------
Total memory allocated 79121448960; in additional pool allocated 0
Dictionary memory allocated 776119
Buffer pool size   4718590
Free buffers       4682063
Database pages     36395
Old database pages 13627
Modified db pages  23223
Pending reads 0
Pending writes: LRU 0, flush list 0, single page 0
Pages made young 672, not young 0
2.90 youngs/s, 0.00 non-youngs/s
Pages read 36066, created 329, written 323
75.09 reads/s, 1.50 creates/s, 0.00 writes/s
Buffer pool hit rate 985 / 1000, young-making rate 0 / 1000 not 0 / 1000
Pages read ahead 0.00/s, evicted without access 0.00/s, Random read ahead 5.00/s
LRU len: 36395, unzip_LRU len: 0
I/O sum[0]:cur[80], unzip sum[0]:cur[0]

As you can see above, the total allocated main memory for Buffer Pool is 79121448960, with some space for the InnoDB’s dictionary, the actual size of the buffer pool, the amount of space, that is, 4682063, what is 292629 in terms of data pages, considering 16kb pages, the amount of old pages the remains in the buffer pool and all the modified or dirty pages – those that were modified by an UPDATE, for example, and haven’t flushed to disk yet. Pending reads and writes indicates the amount of pages which were written to the buffer pool and haven’t flushed yet as the flush list and the amount in terms of pages.

A good point that called my attention was the read ahead and evictions noticed by the output above. “The read ahead request is an I/O request to prefetch multiple pages in the buffer pool asynchronously, in anticipation that these pages will be needed soon”. This will tell us how many pages were copied into the buffer pool and were evicted without being accessed anytime. I think it costs a little bit to get more pages than necessary into the buffer pool as the mechanism must discard pages which are not being accessed, even being this process asynchronous.

Recently, I’ve got very curious about the spin rounds behavior and I realized that if you have many transactions in sleep state inside InnoDB, waiting to be executed, perhaps it may be a spin round problem. The output of SHOW ENGINE INNODB STATUS will show you that…

----------
SEMAPHORES
----------
OS WAIT ARRAY INFO: reservation count 13701
--Thread 140549419812608 has waited at log0log.ic line 321 for 0.00 seconds the semaphore:
Mutex at 0x7c10f4b8 created file log0log.cc line 737, lock var 1
waiters flag 1
OS WAIT ARRAY INFO: signal count 15206
Mutex spin waits 607605, rounds 3114855, OS waits 8383
RW-shared spins 9396, rounds 101453, OS waits 1626
RW-excl spins 6569, rounds 137971, OS waits 3191
Spin rounds per wait: 5.13 mutex, 10.80 RW-shared, 21.00 RW-excl

What does it mean, so?

• Mutex spin waits 607605 is the number of times a thread tried to get a mutex and it wasn’t available, so it waited in a spin-wait;
• rounds 3114855 is the number of times threads looped in the spin-wait cycle, checking the mutex.
• OS waits 8383 is the number of times the thread gave up spin-waiting and went to sleep state instead.

In the SEMAPHORES output above we can observe a case of a fine tuning is needed to avoid context switches. It costs lots of computational resources to maintain information about the actual executing status to restore it as soon as possible. The RW-shared is high, but this is not the real problem. The real problem is happening around RW-excl which acquires locks and make the amount of rounds higher even on the OS level. The final result, 21 waits in the last five seconds.

I will comment more about it soon, cheers!

AddThis Social Bookmark Button

MySQL 5.6 Thread Pool

setembro 30th, 2013 | by: Bianchi | Posted in: MySQL A&D, MySQL Tuning | No Comments »

Tendo em vista o problema já discutido aqui neste blog com relação à escala de conexão de usuários versus criação de threads no MySQL versus sistema operacional – no caso, um CentOS 6.0 – decidi recentemente parar para dar uma lida no manual do MySQL e verificar nos mínimos detalhes o que a feature promete. Já havia feito alguns testes há algum tempo atrás, mas, recordar é viver.

O Thread Pool, plugin que integra a versão Enterprise do MySQL oferecida pela Oracle, veio com a intenção de aumentar o poder de escala quando o assunto é quantidade de usuários. Por mais que eu considere que é melhor você resolver consultas mais rapidamente com boa performance do que ficar acumulando usuários no sistema de gerenciamento de bancos de dados e assim, causar um processamento muito mais acentuado por via da criação de threads, ainda assim temos que contar com os long-running-statements que podem tomar grande parte dos recursos do host de servidor de bancos de dados.

A intenção do plugin é fazer com que o MySQL escala mais com mais quantidade de conexões realizadas. Segundo o que diz o manual, quanto mais conexões, mais estável e mais rápido será a resposta do engine (mysqld). Antes então do que mais interessa, alguns pontos de atenção:

  • O Thread Pool não vem habilitado por padrão, você precisa configurar a leitura do plugin;
  • Suas variáveis de ambiente somente serão carregadas caso o plugin seja carregado;

Após habiltar o plugin, verifique as variáveis de ambiente e entenda o que cada uma delas faz.

Saiba mais através do manual. Não vou tratar dos detalhes pois, minha ansiedade aqui é exibir que o recursos realmente tem um resultado muito bom e com isso, exibo abaixo os resultados de um pequeno benchmark com o mysqlslap…

[root@threadpool ~]# mysqlslap --user=root --password=123456 --auto-generate-sql --concurrency=100,150,200,250,300 --number-of-queries=2000
Warning: Using a password on the command line interface can be insecure.
Benchmark
Average number of seconds to run all queries: 2.675 seconds
Minimum number of seconds to run all queries: 2.675 seconds
Maximum number of seconds to run all queries: 2.675 seconds
Number of clients running queries: 100
Average number of queries per client: 20

Benchmark
Average number of seconds to run all queries: 2.224 seconds
Minimum number of seconds to run all queries: 2.224 seconds
Maximum number of seconds to run all queries: 2.224 seconds
Number of clients running queries: 150
Average number of queries per client: 13

Benchmark
Average number of seconds to run all queries: 2.363 seconds
Minimum number of seconds to run all queries: 2.363 seconds
Maximum number of seconds to run all queries: 2.363 seconds
Number of clients running queries: 200
Average number of queries per client: 10

Benchmark
Average number of seconds to run all queries: 2.035 seconds
Minimum number of seconds to run all queries: 2.035 seconds
Maximum number of seconds to run all queries: 2.035 seconds
Number of clients running queries: 250
Average number of queries per client: 8

Benchmark
Average number of seconds to run all queries: 1.984 seconds
Minimum number of seconds to run all queries: 1.984 seconds
Maximum number of seconds to run all queries: 1.984 seconds
Number of clients running queries: 300
Average number of queries per client: 6


O próximo passo é verificar a quantidade de consultas estagnadas (stalled) através da tabela INFORMATION_SCHEMA.TP_THREAD_GROUP_STATS, que somente estará disponível caso o servidor esteja utilizando o Thread Pool plugin.

mysql> call test.stalledThreads;
+-------------------------------------------------------+
| SUM(STALLED_QUERIES_EXECUTED) / SUM(QUERIES_EXECUTED) |
+-------------------------------------------------------+
| 0.0000                                                |
+-------------------------------------------------------+
1 row in set (0.00 sec)
Query OK, 0 rows affected (0.00 sec)

Sem stalled queries, em breve vou postar o Thread Pool in action, até!

AddThis Social Bookmark Button

Got an error reading communication packets

julho 12th, 2012 | by: Bianchi | Posted in: MySQL A&D, MySQL Manutenção | No Comments »

O nome desse post é exatamente a mensagem de erro que você provavelmente poderá receber ao verificar o estado de saúde do seu servidor de bancos de dados MySQL, nesse caso, um MySQL 5.0. Na semana atual estou trabalhando com um cliente localizado no Brasil que tem cerca de 1502 conexões simultâneas no MySQL, este que é o repositório de informações de um ERP que centraliza as operações da empresa. São várias lojas acessando um mesmo MySQL configurado com um repositório central – obviamente, anteriormente, este cliente passou a operara com servidores em replicação, onde temos um servidor MASTER e outros 7 SLAVEs, cada qual com funções distintas.

Enfim, independentemente da arquitetura do cliente, encontramos um problema logo depois que a mesma começou a rodar. Ao consultar o logo de erro do MySQL, encontramos o seguinte cenário:

root@master1:/var/log# tail -f /var/log/mysql/mysql.err
120712 14:22:55 [Warning] Aborted connection 173570 to db: 'unconnected' user: 'sink01' host: '' (Got an error reading communication packets)
120712 14:23:15 [Warning] Aborted connection 173025 to db: 'unconnected' user: 'sink01' host: '' (Got an error reading communication packets)
120712 14:27:48 [Warning] Aborted connection 169655 to db: 'unconnected' user: 'sink01' host: '' (Got an error reading communication packets)
120712 14:29:00 [Warning] Aborted connection 165547 to db: 'sqldados' user: 'root' host: '' (Got an error reading communication packets)
120712 14:29:23 [Warning] Aborted connection 172752 to db: 'unconnected' user: 'sink02' host: '' (Got an error reading communication packets)
120712 14:30:27 [Warning] Aborted connection 173886 to db: 'unconnected' user: 'sink01' host: '' (Got an error reading communication packets)
120712 14:31:54 [Warning] Aborted connection 174079 to db: 'unconnected' user: 'sink18' host: '' (Got an error reading communication packets)
120712 14:34:16 [Warning] Aborted connection 171530 to db: 'sqldados' user: 'root' host: '' (Got an error reading communication packets)

Inicialmente, pensamos ser um problema de latência de rede onde a conexão para leitura e escrita estavam sen fechadas, mesmo com o status da thread continuando em SLEEP. Sendo assim, ajustamos as variáveis net_% do MySQL. O primeiro passo foi resetar todas elas:

mysql> set net_buffer_length = DEFAULT;
Query OK, 0 rows affected (0.00 sec)

mysql> show global variables like 'net%';
+-------------------+-------+
| Variable_name     | Value |
+-------------------+-------+
| net_buffer_length | 16384 |
| net_read_timeout  | 60    |
| net_retry_count   | 10    |
| net_write_timeout | 60    |
+-------------------+-------+
4 rows in set (0.01 sec)

Para testarmos a eliminação do erro, configuramos as variáveis net_read_timeout e net_write_timeout com um valor maior:

mysql> set global net_write_timeout=360;
Query OK, 0 rows affected (0.00 sec)

mysql> set global net_write_timeout=360;
Query OK, 0 rows affected (0.00 sec)

mysql> show global variables like 'net%';
+-------------------+-------+
| Variable_name     | Value |
+-------------------+-------+
| net_buffer_length | 16384 |
| net_read_timeout  | 360   |
| net_retry_count   | 10    |
| net_write_timeout | 360   |
+-------------------+-------+
4 rows in set (0.00 sec)

Mesmo assim, o erro não foi corrigido e acompanhando o log de erro com tail -f, ele voltou a aparecer…a solução foi ajustar o max_allowed_packet para suportar pacotes maiores e então o erro foi corrigido.

mysql> select concat(format(@@max_allowed_packet/1024/1024,2),'MB') "max_allowed_packet";
+--------------------+
| max_allowed_packet |
+--------------------+
| 16.00MB            |
+--------------------+
1 row in set (0.01 sec)

mysql> set max_allowed_packet=128*1024*1024;
Query OK, 0 rows affected (0.00 sec)

mysql> select concat(format(@@max_allowed_packet/1024/1024,2),'MB') "max_allowed_packet";
+--------------------+
| max_allowed_packet |
+--------------------+
| 128.00MB           |
+--------------------+
1 row in set (0.01 sec)

Após isto, observamos o log por mais 2 horas e não houve mais ocorrência do erro “Got an error reading communication packets”. Vale salientar também que este erro pode ser causado quando o aplicativo que se conecta ao MySQL não finaliza uma conexão de maneira apropriada (sem um mysql_close(), por exemplo), incrementando a variável de status Aborted_clients.

mysql> show global status like 'Aborted%';
+------------------+-------+
| Variable_name    | Value |
+------------------+-------+
| Aborted_clients  | 2866  |
| Aborted_connects | 17    |
+------------------+-------+
2 rows in set (0.00 sec)

AddThis Social Bookmark Button

Estressando o MySQL com o mysqlslap

junho 15th, 2012 | by: Bianchi | Posted in: MySQL A&D, MySQL Manutenção, MySQL Tuning | 2 Comments »

Não é de hoje que é necessário efetuar vários testes antes de colocar um servidor em produção e para isso, as vezes os testes que a turma de desenvolvimento elabora não são os melhores na visão do administrador de bancos de dados. Na verdade, os dois times precisam estar juntos e alinhados para a realização de tal tarefa para que nada escape aos olhos e ao entendimento de ambos os pontos de vista, tanto da aplicação quanto do banco de dados, sendo que, testes de estresse ou ainda, os benchmarks, são um fator determinante para que um produto para ser eleito como solução ou não.

Nessa semana tivemos um interação interessante com um cliente no Brasil que precisou ter certeza de que um servidor de bancos de dados MySQL poderia entrar em produção para atender a uma grande demanda e por isso, nos chamou, para rever toda a configuração, além de corrigir métricas de performance, revisar discos, memória e poder de processamento. É isso, após o trabalho utilizamos o “mysqlslap” que é uma suite de benchmark nativa do MySQL, disponibilizada juntamente com vários programas clientes e não clientes no momento da instalação do servidor de bancos de dados mais popular do mundo. Várias são as opções que podem ser utilizadas com o mysqlslap que ao ser utilizado a primeira vez, cria uma base de dados para administrar os seus próprios metadados.

O que quero mostrar aqui é que, após executar uma auditoria e um bom tuning na instância de MySQL do cliente, que roda em Red Hat 6, rodamos alguns scripts personalizados, criados pela WBConsultinga para otimizar dados em páginas de dados e atualizar estatísticas de objetos, iniciamos os testes com o mysqlslap, primeiro para verificar se teríamos problemas com o número de conexão simultâneas de usuários de 3000 que o cliente requisitou para o sistema.

Executamos então o primeiro teste com 3000 clientes disparando 1000 consultas em conexão simultânea…

[root@mysqlsrv101 ~]# mysqlslap --user=root --password=XXX --auto-generate-sql --concurrency=3000 --number-of-queries=1000
Benchmark
Average number of seconds to run all queries: 33.098 seconds
Minimum number of seconds to run all queries: 33.098 seconds
Maximum number of seconds to run all queries: 33.098 seconds
Number of clients running queries: 3000
Average number of queries per client: 0

O tempo de uma iteração único poderá ser alto se imaginarmos que temos consultas ad hoc. Mas, para isso, o mysqlslap tem uma opção que permite controlar quantas vezes você deseja repetir aquela mesma iteração (-i ou –itereations). Executamos  -i 5 e assim, notamos que os ajustes de caches e buffers estão trabalhando bem…

[root@mysqlsrv101 ~]# mysqlslap --user=root --password=XXX --auto-generate-sql --concurrency=3000 --auto-generate-sql-write-number=100 -i 5
Benchmark
Average number of seconds to run all queries: 19.387 seconds
Minimum number of seconds to run all queries: 17.967 seconds
Maximum number of seconds to run all queries: 22.998 seconds
Number of clients running queries: 3000
Average number of queries per client: 0

Tivemos então os tempos médio (average) mínimo (minimum) mais baixos que executando consultas ad hoc. Consultando as variáveis de status do MySQL, percebemos que muita informação foi agregada às estruturas de memória, tanto para o InnoDB Buffer Pool quanto para o MyISAM Key Buffer.

mysql> show status like 'Innodb_buffer_pool%';
+---------------------------------------+-----------+
| Variable_name                         | Value     |
+---------------------------------------+-----------+
| Innodb_buffer_pool_pages_data         | 5638      |
| Innodb_buffer_pool_pages_dirty        | 0         |
| Innodb_buffer_pool_pages_flushed      | 13895     |
| Innodb_buffer_pool_pages_free         | 518648    |
| Innodb_buffer_pool_pages_misc         | 1         |
| Innodb_buffer_pool_pages_total        | 524287    |
| Innodb_buffer_pool_read_ahead_rnd     | 0         |
| Innodb_buffer_pool_read_ahead         | 0         |
| Innodb_buffer_pool_read_ahead_evicted | 0         |
| Innodb_buffer_pool_read_requests      | 764868549 |
| Innodb_buffer_pool_reads              | 1865      |
| Innodb_buffer_pool_wait_free          | 0         |
| Innodb_buffer_pool_write_requests     | 665820    |
+---------------------------------------+-----------+
13 rows in set (0.01 sec)

mysql> show status like 'Key_%';
+------------------------+---------+
| Variable_name          | Value   |
+------------------------+---------+
| Key_blocks_not_flushed | 1023    |
| Key_blocks_unused      | 17      |
| Key_blocks_used        | 2514736 |
| Key_read_requests      | 0       |
| Key_reads              | 2876589 |
| Key_write_requests     | 4566867 |
| Key_writes             | 4567890 |
+------------------------+---------+
7 rows in set (0.00 sec)

Finalmente, um teste de evolução de conexões simultâneas, inciando em 500, indo a 1000, 1500 e finalmente para 3000:

[root@mysqlsrv101 ~]# mysqlslap --user=root --password=XXX --auto-generate-sql --concurrency=500,1000,1500,3000 --number-of-queries=100
Benchmark
Average number of seconds to run all queries: 3.084 seconds
Minimum number of seconds to run all queries: 3.084 seconds
Maximum number of seconds to run all queries: 3.084 seconds
Number of clients running queries: 500
Average number of queries per client: 0

Benchmark
Average number of seconds to run all queries: 4.054 seconds
Minimum number of seconds to run all queries: 4.054 seconds
Maximum number of seconds to run all queries: 4.054 seconds
Number of clients running queries: 1000
Average number of queries per client: 0

Benchmark
Average number of seconds to run all queries: 6.993 seconds
Minimum number of seconds to run all queries: 6.993 seconds
Maximum number of seconds to run all queries: 6.993 seconds
Number of clients running queries: 1500
Average number of queries per client: 0

Benchmark
Average number of seconds to run all queries: 16.021 seconds
Minimum number of seconds to run all queries: 37.092 seconds
Maximum number of seconds to run all queries: 22.008 seconds
Number of clients running queries: 3000
Average number of queries per client: 0

O resumo da utilização de recursos foi:

Máxima de CPU ao final dos testes: 49%
Máxima de Taxa de IO: 42%
Máxima de utilização de Memória: 70%
Máxima de Swap: 0%

Conseguimos acertar o número de conexões simultâneas que o cliente precisava ajustando as variáveis @@max_connections e @@max_user_connections de acordo com o que é necessário. O mysqlslap nos auxiliou para colocar o MySQL nos limites que o projeto requisitou e comprovar que o servidor de bancos de dados estava pronto para entrar em produção.

AddThis Social Bookmark Button

Verificando o tamanho de índices e dados!

junho 13th, 2012 | by: Bianchi | Posted in: MySQL Manutenção, MySQL Tuning | No Comments »

Muitas são as tarefas diárias (e também noturnas) que um DBA deverá realizar para trazer o seu servidor de bancos de dados em perfeito funcionamento, acessível pelos clientes e aplicações que acessam dados em um rítimo frenético como nos dias de hoje. Um dos pontos fortes que terá sempre grande atenção é quanto à performance de resposta à leituras e escritas que um servidor de bancos de dados poderá ter. O MySQL é um SGBD muito flexível, completamente customizável e tunável, com uma vasta gama de recursos disponíveis para a busca de melhorias no quesito performance.

Quando se trabalha com um banco de dados, cujas suas tabelas são controladas pelo Storage Engine padrão até a versão 5.1, o MyISAM, poderemos facilmente manter os dados de índices em memória por mais tempo possível, ajustando o MySQL para armazenar um quantidade X de dados destes índices em key_buffer, valor de memória atribuído à variável key_buffer_size. Quanto mais os dados estão em memória, menos buscas em disco (disk-seeks), menos overhead, menos processamento.

Para visualizar o tamanho dos índices de uma base de dados, consultamos a tabela TABLES do dicionário de dados, INFORMATION_SCHEMA do MySQL – note que a maioria das tabelas que compõem o dicionário de dados do MySQL é controlada pelo engine MEMORY, com excessão de algumas que são controladas pelo MyISAM. A seguinte consulta trará o tamanho total dos índices, localizados nos arquivos “.MYI” e o tamanho total dos dados, localizados nos arquivos “.MYD“:

Consulta Tamanho de Índices e Dados - utiliznado o INFORMATION_SCHEMA!

Consulta Tamanho de Índices e Dados

Como este é um teste e na minha instância de MySQL eu não tenho nenhum banco de dados que eu possa revelar informações, o tamanho dos índices e o tamanho dos dados estão zerados, mas, quando você rodar esta consulta em sua base de dados de produção, será possível recuperar informações diferentes de zero. A partir disso, teremos então o tamanho necessário de memória para começar a trabalhar as métricas de performance para o MyISAM, baseado no key_buffer_size. Dependendo do tamanho do seu hardware, trabalhar outros pontos do MySQL será mais que necessário para poder dar realmente poder de resposta para o servidor de bancos de dados para que as trocas sejam bem feitas.

Uma dica além das que já foram dadas, mantenha as estatísticas dos seus bancos de dados o mais atualizadas possível com ANALYZE e/ou OPTIMIZE.

Dúvidas? Aguardo seu comentário.

AddThis Social Bookmark Button

Agilizando a carga de dados e restore no MySQL

maio 13th, 2012 | by: Bianchi | Posted in: MySQL A&D, MySQL Backup, MySQL Manutenção, MySQL Tuning | No Comments »

Muitos são os amigos que escrevem perguntando como agilizar a carga de dados ou restore de um backup no MySQL. Realmente, dependendo do tamanho do seu hardware, configuração dos Storage Engines e variáveis per-client e design do seu banco de dados, esse processo poderá levar várias horas caso alguns cuidados não sejam tomados antes do início do processo. Há pouco tempo atrás, trabalhando em uma consultoria aonde o cliente precisava fazer uma carga diária de toda a movimentação nas contas onde todas as informações eram consistidas em arquivos texto, finalizamos a nossa prestação de serviços após termos desenvolvido um aplicativo que, além de fazer a carga dos dados e vários tratamentos em meio aos LOAD DATA INFILE, configuramos vários pontos do MySQL no runtime do aplicativo para que o processo fosse realmente “agilizado”.

São vários os pontos a serem observados:

  • Índices KEY, UNIQUE e FULLTEXT, para tabelas MyISAM;
  • Chaves estrangeiras ou foreign keys, para tabelas InnoDB;
  • o modo AUTOCOMMIT, para tabelas InnoDB.
Para os testes que faremos neste post, utilizaremos uma máquina virtual rodando o CentOS 6.0, com o MySQL 5.6.

[root@master ~]# mysqladmin -u root -p123456 version
mysqladmin Ver 8.42 Distrib 5.6.4-m7, for Linux on i686


Copyright (c) 2000, 2011, Oracle and/or its affiliates. All rights reserved.
Oracle is a registered trademark of Oracle Corporation and/or its
affiliates. Other names may be trademarks of their respective
owners.

Server version 5.6.4-m7-log
Protocol version 10
Connection Localhost via UNIX socket
UNIX socket /var/lib/mysql/mysql.sock
Uptime: 42 min 17 sec

Para desabilitar Índices KEY e UNIQUE, basta que você crie um select ou mesmo um script para percorrer tabela por tabela do seu modelo físico de bancos de dados para desabilitar os índices de cada uma delas. Gosto de fazer isso via mysql client com a opção -B maiúsculo, que executa a conexão com o mysqld em modo batch. Caso você tenha mais segurança em utilizar os recursos do MySQL em conjunto com o file system, você pode utilizar o SELECT … INTO OUTFILE.

# criamos as tabelas com índices KEY, ou seja, índices que são estruturas utilizadas para melhoria da performance na busca de dados
[root@master ~]# for i in {1..5}; do mysql -u root -p123456 test -e "create table tb$i(id$i int,key(id$i)) engine=myisam;"; done

# exibimos as tabelas criadas
[root@master ~]# mysql -u root -p123456 -e "show tables from test like 'tb%'"
+----------------------+
| Tables_in_test (tb%) |
+----------------------+
| tb1                  |
| tb2                  |
| tb3                  |
| tb4                  |
| tb5                  |
+----------------------+

# exibimos os índices criados nas colunas id das tabelas que acabamos de criar
[root@master ~]# mysql -u root -p123456 -e "select column_name, column_key from information_schema.columns where table_schema='test' and table_name like 'tb%'"
+-------------+------------+
| column_name | column_key |
+-------------+------------+
| id1         | MUL        |
| id2         | MUL        |
| id3         | MUL        |
| id4         | MUL        |
| id5         | MUL        |
+-------------+------------+

Agora que temos índices à desabilitar, podemos rodar um SELECT que nos devolverá os comandos ALTER TABLE necessários para desabilitar os índices das tabelas do banco de dados alvo da carga de dados.

# executando em modo batch
[root@master ~]# mysql -u root -p123456 -B -e "select concat('alter table ',table_name,' disable keys;') from information_schema.tables where table_schema='test'"
concat('alter table ',table_name,' disable_keys;')
alter table t1 disable keys;
alter table t2 disable keys;
alter table t3 disable keys;
alter table tb1 disable keys;
alter table tb2 disable keys;
alter table tb3 disable keys;
alter table tb4 disable keys;
alter table tb5 disable keys;

# executando com SELECT ... INTO OUFILE
[root@master ~]# mysql -u root -p123456 -e "select concat('alter table ',table_name,' disable keys;') into outfile '/tmp/alterDisableKey' from information_schema.tables where table_schema='test'"
[root@master ~]#

Considerando a segunda opção, volte ao mysql e execute o conteúdo do arquivo que foi salvo em /tmp
# executando o arquivo via source

[root@master ~]# mysql -u root -p123456 test -e "source /tmp/alterDisableKey;"
# confirmando que os índices foram desabilitados

mysql> show index from tb1\G
*************************** 1. row ***************************
Table: tb1
Non_unique: 1
Key_name: id1
Seq_in_index: 1
Column_name: id1
Collation: A
Cardinality: NULL
Sub_part: NULL
Packed: NULL
Null: YES
Index_type: BTREE
Comment: disabled # desabilitado!
Index_comment:
1 row in set (0.00 sec)

Após realizar a carga de dados, ALTER TABLE <table_name> ENABLE KEYS!

Para que as foreign keys ou chaves estrangeiras em tabelas InnoDB tenham suas checagens desabilitadas (o processo de checagem de integridade referencial realmente atrasa o restore de dados) é um processo mais tranquilo que o anterior. Basta que você, na sua sessão, reconfigure o valor da variável de ambiente foreign_key_checks, como vemos logo abaixo:

mysql> show variables like 'foreign%';
+--------------------+-------+
| Variable_name      | Value |
+--------------------+-------+
| foreign_key_checks | ON    |
+--------------------+-------+
1 row in set (0.00 sec)

mysql> SET FOREIGN_KEY_CHECKS=OFF;
Query OK, 0 rows affected (0.05 sec)

mysql> SET FOREIGN_KEY_CHECKS=0;
Query OK, 0 rows affected (0.00 sec)

mysql> show variables like 'foreign%';
+--------------------+-------+
| Variable_name      | Value |
+--------------------+-------+
| foreign_key_checks | OFF   |
+--------------------+-------+
1 row in set (0.00 sec)

O ponto final para finalizarmos este post, o AUTOCOMMIT! Primeiro, vamos entender o que esse cara faz e o que ele controla. Como o InnoDB é um Storage Engine transacional, a cada UPDATE, INSERT ou DELETE que é executado, o InnoDB cuida para enviar um COMMIT logo após tais consultas; isso, quando AUTOCOMMIT está configurado como 1 ou ON, que é o valor default. Como queremos fazer várias operações e somente ao final dar um COMMIT explícito, o que é feito pelo mysqldump com um arquivo de backup gerado com a opção -e, precisamos configurar o AUTOCOMMIT com o valor OFF ou 0.

# configurando autocomit no arquivo de configuração do MySQL, salev o mesmo e reinicie o MySQL
[root@master ~]# vim /etc/my.cnf

[mysqld]
autocommit=0

[root@master ~]# service mysql restart
Shutting down MySQL ... [ OK ]
Starting MySQL      ... [ OK ]

Pronto, agora o seu servidor de bancos de dados MySQL já está configurado para passar por processos de restore de forma mais rápida e também ser alvo de cargas de dados pesadas. Um adicional é, procure saber como funciona a variável bulk_insert_buffer_size, ela também ajudará neste quesito.

Até.


AddThis Social Bookmark Button

InnoDB e os Logs de Transação

março 18th, 2012 | by: Bianchi | Posted in: MySQL Tuning | No Comments »

Um dos desafios mais interessantes no MySQL atualmente é conseguir aplicar ao servidor de bancos de dados, o mysqld, uma boa configuração relacionada com o InnoDB Plugin. Digo uma configuração, pois, atingir um nível de melhoria de performance não é lá tão fácil, mesmo sabendo o significado e os possíveis valores de cada uma daquelas variáveis e tendo ciência que, se você altera a quantidade de arquivos de log, você precisa também alterar outros parâmetros para que realmente faça sentido todo o trabalho realizado. Pode parecer que é uma ação de configuração mais tranquila, mas, na verdade, não é.

Desde a sua concepção, o servidor de bancos de dados MySQL utiliza os conceitos “variáveis de ambiente” e “variáveis de status“, onde, respectivamente, as variáveis de ambiente são aquelas que receberão os possíveis valores para que um determinado comportamento seja desenhado (innodb_flush_method=O_DIRECT, por exemplo), enquanto que, as variáveis de status são registradores internos que são incrementados (em bytes ou número de ocorrência) para que determinadas ações possam ser realizadas com base em fatos reais.

Por que eu falei isso tudo até agora? Na verdade, nesse final de semana trabalhei com um novo cliente que rodava o MySQL 5.1.49 e migramos para o MySQL 5.5. Mesmo após todos os ajustes necessários para fazer com que o novo ambiente utilize as novas features do produto (clique aqui e veja o que mudou), notei problemas de lentidão e fui investigar. Primeiro, contei com o SMART para testar os discos, que são discos de 15K rodando muito bem. Analisei por uma hora e meia o comportamento de memória com o htop, vmstat e atop. Nada foi encontrado, mas, consegui perceber que havia uma movimentação de I/O muito grande quando o MySQL fazia o flush das páginas sujas do buffer para o disco.

O processo de flush no MySQL é bem parecido com este mesmo processo que ocorre no Oracle; que pode acontecer por 4 motivos: 1-) quantidade de páginas sujas no limite; 2-) um checkpoint aconteceu; 3-) um COMMIT foi enviado ou ainda, 4-) de acordo com um limite de tempo que determinado pela variável innodb_flush_log_at_trx_commit, isso no MySQL, obviamente;

Se formos analisar à grosso modo, “in broad terms”, o log de transação do InnoDB é o redo log do Oracle, já que a idéia é muito parecida. Por padrão, após qualquer instalação, seja ela no MS Windows ou em qualquer sabor de Linux/Unix, você notará que 2 arquivos de log foram criados no DATADIR do MySQL; dois arquivos que seguem o padrão de denominação ib_logfilex, onde x é um número sequencial. Tais arquivos, se tiver os seus tamanhos somados, não podem ultrapassar ou mesmo ter o valor da soma igual à 4GB ou 4096MB. Geralmente eu configurações que criam vários arquivos de 398MB, por exemplo.

[root@shaftserver01 mysql]# ls -lh | grep ib
-rw-rw----. 1 mysql mysql 1,0G Mar 18 11:34 ibdata1
-rw-rw----. 1 mysql mysql 380M Mar 18 11:34 ib_logfile0
-rw-rw----. 1 mysql mysql 380M Mar 18 11:33 ib_logfile1
-rw-rw----. 1 mysql mysql 380M Mar 18 11:33 ib_logfile2
-rw-rw----. 1 mysql mysql 380M Mar 18 11:33 ib_logfile3
-rw-rw----. 1 mysql mysql 380M Mar 18 11:33 ib_logfile4
-rw-rw----. 1 mysql mysql 380M Mar 18 11:33 ib_logfile5
-rw-rw----. 1 mysql mysql 380M Mar 18 11:33 ib_logfile6
-rw-rw----. 1 mysql mysql 380M Mar 18 11:33 ib_logfile7
-rw-rw----. 1 mysql mysql 380M Mar 18 11:33 ib_logfile8
-rw-rw----. 1 mysql mysql 380M Mar 18 11:33 ib_logfile9

O que te faz pensar que é necessário aumentar a quantidade de arquivos ou mesmo, o espaço disponível para os logs? Uma variável de status que pouca gente dá valor e sabe que ela existe para medir se há eficiência no processo de gravação de logs em disco. A eficiência é justamente nesse processo é justamente não ter que “esperar” para poder gravar logs nos arquivos e portanto, se um flush tiver que aguardar a liberação de espaço, é hora de acrescentar mais arquivos de log e também, disponibilizar mais espaço – um lembrete, os logs são primeiro armazenados no log buffer e depois, nas condições já citadas, são “flusheados” para disco, sendo gravados nos arquivos de maneira circular.

Não há no MySQL a possibilidade de arquivar logs antes que tais arquivos sejam reutilizados. No caso de você querer reconstruir os bancos a partir dos vetores de alterações que passaram pelos logs de transação do InnoDB, utilize o log binário, que, ele sim é o cara que poderá lhe ajudar com a tarefa de recriar o banco.

Voltando ao problema, se a variável de status Innodb_log_waits for maior que zero, considere reconfigurar o servidor MySQL:

mysql> show status like 'innodb_log_waits';
+------------------+-------+
| Variable_name | Value |
+------------------+-------+
| Innodb_log_waits | 3287 |
+------------------+-------+
1 row in set (0.00 sec)

Reconfigurando os logs, você poderá ter problemas ao reinicializar o MySQL. Sendo assim, você precisa excluir os logs de transação atuais e então, reiniciar o MySQL.

Até!

AddThis Social Bookmark Button

MySQL server has gone away

janeiro 18th, 2012 | by: Bianchi | Posted in: MySQL Manutenção, MySQL Tuning | 1 Comment »

Esta é uma mensagem de erro que acontece em muitos dos servidores de bancos de dados MySQL instalados aí pelo mundo e muitos dos usuários se vêem em uma situação que talvez não tenha solução. Há bastante tempo eu tenho respondido à fóruns de discussão que tratam do tema que é simples de resolver. A minha esperança é que o google indexe logo o título deste post para que tal informação de como se livrar da mensagem MySQL server has gone away em meio à operações de carga de dados, restore de um banco ou mesmo, em meio às interações do aplicação com o servidor MySQL.

Existe uma variável de ambiente no MySQL que controla este comportamento e também, o tamanho máximo dos pacotes que podem trafegar nas threads do MySQL. Você deve saber que cada thread é um conexão e você poderá ter informações sobre elas através do comando SHOW PROCESSLIST. O tamanho inicial é configurado na variável net_buffer_lentgh e o tamanho máximo é configurado em max_allowed_packet – esta variável que poderá ter um valor pequeno para o sistema que já se tornou grande.

Por exemplo, no início deste ano iniciei os trabalhos com um cliente no Brasil e precisamos na quele momento fazer a carga de grande de quantidade de dados em XML, que é um tipo de log que o cliente armazena para devidos fins. Ao iniciar as cargas com os arquivos de mais ou menos 300GB por vez, nos deparamos com o “MySQL server has gone away” ou em Português, “O MySQL foi embora”. Não é para mim uma mensagem e nem um comportamento novo, e foi somente fazer alguns ajustes no my.cnf, mais precisamente, na variável max_allowed_packet e tudo se resolveu:

[root@motoserver189 ~]# mysql -u root -p imoin_package < /files/log1765390.dump
ERROR 2006 (HY000) at line 59: MySQL server has gone away

# Alteramos o valor de max_allowed_packet para comportar pacotes maiores nas threads do MySQL

[mysqld]
max_allowed_packet=1024M

# Reiniciamos o servidor de bancos de dados MySQL para que as alterações passam a valer

[root@motoserver189 ~]# service mysql restart
Starting MySQL....................................... SUCCESS!

# Tentamos novamente e como agora vai dar tudo certo, embrulhamos o comando de restore no nohup que passa a execução do processo para o processo do Linux para se caso nossa conexão com o servidor seja fechada, o processo de restore não sofrerá nenhum impacto.

[root@motoserver189 ~]# nohup mysql -u root -p imoin_package < /files/log1765390.dump &
[1] 26303
[root@bd14 mysql]# nohup: appending output to `nohup.out'

Até…

AddThis Social Bookmark Button

Particionando o InnoDB Buffer Pool

dezembro 21st, 2011 | by: Bianchi | Posted in: MySQL Manutenção, MySQL Tuning | No Comments »

O título deste artigo é bastante sugestivo do ponto de vista de performance em bancos de dados. Geralmente, independente do tipo de particionamento, horizontal ou vertical, ele servirá para eliminar overheads em operações adicionais na escrita e/ou recuperação de dados. Com o InnoDB Buffer Pool, a partir da versão 5.5 não é diferente, pois, poderemos utilizar uma nova variável, aplicada somente ao InnoDB Plugin que nos possibilita dividir o Buffer Pool (área de memória que armazena índices e dados de tabelas InnoDB) em várias instâncias, sendo que cada uma das instâncias deverá ter no mínimo 1GB de espaço. Então, neste cenário, caso tenhamos um innodb_buffer_pool_size igual à 2GB, poderemos ter a variável innodb_buffer_pool_instances=2.

As principais vantagens de ser ter um Buffer Pool particionado é a possibilidade de que cada uma das instâncias poder controlar sua própria lista, que é baseada no algorítimo LRU (Least Recently Used), armazenam bem menos de dados que uma só instância, o que possibilita menos tempo para localizar um determinado dado na memória em meio à menos dados.

Uma boa analogia para a busca do entendimento é, imagine que você deixa o seu carro em um estacionamento de shopping que tem capacidade para 1000 carros. Você pára o seu carro e se você não tiver uma boa noção de espaço, quando voltar para buscá-lo poderá gastar vários minutos para achá-lo. Agora, imagine que este mesmo estacionamento agora conta com setores, algo como A1, A2, B1, B2 e etc. Neste cenário, quando você parar o carro, você saberá em qual setor o seu carro está parado, sendo que em cada setor, a lotação máxima é de somente 50 carros. Você procura seu carro em meio a um número muito menor do que se você tivesse que procurá-lo em meio à todos os carros.

As configurações (exemplo) podem ser como seguem:

[mysqld]
innodb_buffer_pool_size=16G
innodb_buffer_pool_instances=8

No exemplo acima, temos 8 instâncias do Buffer Pool, cada uma delas com 2GB de espaço para dados e índices de tabelas InnoDB. Podemos ainda monitorar o que está acontecendo com cada uma das instâncias de InnoDB Buffer Pool através do comando SHOW ENGINE INNODB STATUS, observando a seção “INDIVIDUAL BUFFER POOL INFO”:

----------------------
INDIVIDUAL BUFFER POOL INFO
----------------------
---BUFFER POOL 0
Buffer pool size 131071
Free buffers 20999
Database pages 109854
Old database pages 40564
Modified db pages 2
Pending reads 0
Pending writes: LRU 0, flush list 0, single page 0
Pages made young 11, not young 0
0.00 youngs/s, 0.00 non-youngs/s
Pages read 106393, created 3461, written 70472
0.00 reads/s, 0.02 creates/s, 0.80 writes/s
Buffer pool hit rate 1000 / 1000, young-making rate 0 / 1000 not 0 / 1000
Pages read ahead 0.00/s, evicted without access 0.00/s, Random read ahead 0.00/s
LRU len: 109854, unzip_LRU len: 190
I/O sum[0]:cur[0], unzip sum[0]:cur[0]
---BUFFER POOL 1
Buffer pool size 131071
Free buffers 20192
Database pages 110633
Old database pages 40859
Modified db pages 1
Pending reads 0
Pending writes: LRU 0, flush list 0, single page 0
Pages made young 21, not young 0
0.00 youngs/s, 0.00 non-youngs/s
Pages read 107355, created 3278, written 50788
0.00 reads/s, 0.00 creates/s, 0.48 writes/s
Buffer pool hit rate 1000 / 1000, young-making rate 0 / 1000 not 0 / 1000
Pages read ahead 0.00/s, evicted without access 0.00/s, Random read ahead 0.00/s
LRU len: 110633, unzip_LRU len: 219
I/O sum[0]:cur[0], unzip sum[0]:cur[0]
---BUFFER POOL 2
Buffer pool size 131071
Free buffers 19981
Database pages 110840
Old database pages 40935
Modified db pages 1
Pending reads 0
Pending writes: LRU 0, flush list 0, single page 0
Pages made young 11, not young 0
0.00 youngs/s, 0.00 non-youngs/s
Pages read 107052, created 3788, written 65778
0.00 reads/s, 0.00 creates/s, 0.48 writes/s
Buffer pool hit rate 1000 / 1000, young-making rate 0 / 1000 not 0 / 1000
Pages read ahead 0.00/s, evicted without access 0.00/s, Random read ahead 0.00/s
LRU len: 110840, unzip_LRU len: 223
I/O sum[0]:cur[0], unzip sum[0]:cur[0]
---BUFFER POOL 3
Buffer pool size 131071
Free buffers 18616
Database pages 112208
Old database pages 41440
Modified db pages 1
Pending reads 0
Pending writes: LRU 0, flush list 0, single page 0
Pages made young 17, not young 0
0.00 youngs/s, 0.00 non-youngs/s
Pages read 108448, created 3760, written 48754
0.00 reads/s, 0.00 creates/s, 0.27 writes/s
Buffer pool hit rate 1000 / 1000, young-making rate 0 / 1000 not 0 / 1000
Pages read ahead 0.00/s, evicted without access 0.00/s, Random read ahead 0.00/s
LRU len: 112208, unzip_LRU len: 220
I/O sum[0]:cur[0], unzip sum[0]:cur[0]
---BUFFER POOL 4
Buffer pool size 131071
Free buffers 23980
Database pages 106849
Old database pages 39461
Modified db pages 1
Pending reads 0
Pending writes: LRU 0, flush list 0, single page 0
Pages made young 9, not young 0
0.00 youngs/s, 0.00 non-youngs/s
Pages read 103190, created 3659, written 63331
0.00 reads/s, 0.02 creates/s, 0.70 writes/s
Buffer pool hit rate 1000 / 1000, young-making rate 0 / 1000 not 0 / 1000
Pages read ahead 0.00/s, evicted without access 0.00/s, Random read ahead 0.00/s
LRU len: 106849, unzip_LRU len: 217
I/O sum[0]:cur[0], unzip sum[0]:cur[0]
---BUFFER POOL 5
Buffer pool size 131071
Free buffers 19814
Database pages 111069
Old database pages 41020
Modified db pages 0
Pending reads 0
Pending writes: LRU 0, flush list 0, single page 0
Pages made young 14, not young 0
0.00 youngs/s, 0.00 non-youngs/s
Pages read 106936, created 4133, written 85900
0.00 reads/s, 0.00 creates/s, 0.61 writes/s
Buffer pool hit rate 1000 / 1000, young-making rate 0 / 1000 not 0 / 1000
Pages read ahead 0.00/s, evicted without access 0.00/s, Random read ahead 0.00/s
LRU len: 111069, unzip_LRU len: 162
I/O sum[0]:cur[0], unzip sum[0]:cur[0]
---BUFFER POOL 6
Buffer pool size 131071
Free buffers 18889
Database pages 112005
Old database pages 41340
Modified db pages 1
Pending reads 0
Pending writes: LRU 0, flush list 0, single page 0
Pages made young 5, not young 0
0.00 youngs/s, 0.00 non-youngs/s
Pages read 108175, created 3830, written 83143
0.00 reads/s, 0.00 creates/s, 0.73 writes/s
Buffer pool hit rate 1000 / 1000, young-making rate 0 / 1000 not 0 / 1000
Pages read ahead 0.00/s, evicted without access 0.00/s, Random read ahead 0.00/s
LRU len: 112005, unzip_LRU len: 149
I/O sum[0]:cur[0], unzip sum[0]:cur[0]
---BUFFER POOL 7
Buffer pool size 131071
Free buffers 19352
Database pages 111534
Old database pages 41189
Modified db pages 1
Pending reads 0
Pending writes: LRU 0, flush list 0, single page 0
Pages made young 11, not young 0
0.00 youngs/s, 0.00 non-youngs/s
Pages read 107999, created 3535, written 57687
0.00 reads/s, 0.00 creates/s, 0.41 writes/s
Buffer pool hit rate 1000 / 1000, young-making rate 0 / 1000 not 0 / 1000
Pages read ahead 0.00/s, evicted without access 0.00/s, Random read ahead 0.00/s
LRU len: 111534, unzip_LRU len: 158
I/O sum[0]:cur[0], unzip sum[0]:cur[0]

Perceba que cada instância tem o seu próprio controle de LRU, páginas jovens e velhas, assim como aquelas que se tornaram jovens por serem mais requisitadas e aquelas que se tornaram velhas por serem pouco requisitadas. Quantidade de páginas e quantidade de buffers livres podem também ser observados. Interessante notar que esta seção somente estará presente na saída do SHOW ENGINE INNODB STATUS caso innodb_buffer_pool_instances for maior que zero.

O mais interessante é, para que o InnoDB Buffer Pool funcione bem, particionado ou não, os dados precisam estar lá e para que você, manualmente efetue um “preload” dos dados no buffer, rode esta consulta e depois rode os comandos que ela gerar: 

SELECT
CONCAT('SELECT ',MIN(c.COLUMN_NAME),' FROM ',c.TABLE_NAME,' WHERE ',MIN(c.COLUMN_NAME),' IS NOT NULL')
FROM
information_schema.COLUMNS AS c
LEFT JOIN (
SELECT DISTINCT
TABLE_SCHEMA,TABLE_NAME,COLUMN_NAME
FROM
information_schema.KEY_COLUMN_USAGE
) AS k
USING
(TABLE_SCHEMA,TABLE_NAME,COLUMN_NAME)
WHERE
c.TABLE_SCHEMA = 'yourDatabase'
AND k.COLUMN_NAME IS NULL
GROUP BY
c.TABLE_NAME

Enquanto roda as consultas finais para carregar os dados no Buffer Pool, você poderá utilizar uma interface gráfica qualquer para checar a diminuição do espaço configurado para innodb_buffer_pool_size ou mesmo, checar as variáveis de status que o MySQL possui para monitorar o InnoDB:

mysql> show status like 'Innodb_buffer_pool%'\G
*************************** 1. row ***************************
Variable_name: Innodb_buffer_pool_pages_data
Value: 1639
*************************** 2. row ***************************
Variable_name: Innodb_buffer_pool_pages_dirty
Value: 0
*************************** 3. row ***************************
Variable_name: Innodb_buffer_pool_pages_flushed
Value: 2352
*************************** 4. row ***************************
Variable_name: Innodb_buffer_pool_pages_free
Value: 1046928
*************************** 5. row ***************************
Variable_name: Innodb_buffer_pool_pages_misc
Value: 1
*************************** 6. row ***************************
Variable_name: Innodb_buffer_pool_pages_total
Value: 1048568

 Observe o valor de *Innodb_buffer_pool_pages_free* diminuindo. Isso mostrará que o preload dos dados está realmente funcionando.
Até a próxima.


AddThis Social Bookmark Button

Problemas de escala de usuários com o MySQL

dezembro 17th, 2011 | by: Bianchi | Posted in: MySQL Manutenção, MySQL Tuning | 2 Comments »

Essa semana tive um problema grave em um cliente que precisava escalar o números de conexões simultâneas no MySQL de forma que estas conexões superassem o número de 2000. Vários problemas foram analisados, desde pontos básicos como configurações do próprio servidor de bancos de dados MySQL como alguns pontos relacionados ao Kernel. Somente para situar o leitor em relação ao que foi analisado, no MySQL, temos duas variáveis muito importantes que determinam a quantidade de usuários que podem se conectar ao servidor de bancos de dados e também o números de tais conexões que podem acontecer em um mesmo momento, ou seja, simultâneas.

  1. max_connections – esse é o parâmetro que controla a quantidade de usuários que podem se conectar ao MySQL;
  2. max_user_connections – esse é o parâmetro utilizado para configurar a quantidade de conexões simultâneas que podem acontecer durante o funcionamento do MySQL – segundo o manual, manter o valor desta variável como zero, é o mesmo que dizer que a coisa é ilimitada;

Interessante sabermos que, além das variáveis de ambiente, que são utilizadas para configurar os vários aspectos do MySQL e é com elas que realizamos o tuning, temos também as variáveis de status que cobrem todo o funcionamento do MySQL e é através delas que consultamos o que está acontecendo com o servidor de bancos de dados. Com as questões relacionadas com usuários não é diferente, veja só:

mysql> show status like '%conn%';
+--------------------------+-------+
| Variable_name            | Value |
+--------------------------+-------+
| Aborted_connects         |    0  |
| Connections              | 1387  |
| Max_used_connections     |  645  |
| Ssl_client_connects      |    0  |
| Ssl_connect_renegotiates |    0  |
| Ssl_finished_connects    |    0  |
| Threads_connected        |  581  |
+--------------------------+-------+

Sem pensar nas variáveis SSL que foram retornadas na consulta acima, temos três variáveis bastante importantes: Aborted_connects, Connections, Max_used_connections. Cada uma delas tem um significado ligado diretamente às conexões de clientes/usuários com o servidor de bancos de dados.

  1. Aborted_Connects: se o número desta variável de status estiver alto você poderá estar perdendo conexões por quebra das mesmas, sua aplicação não está chamando um método de de “connection_close” antes de fechar a conexão ou mesmo, seu MySQL está evitando consultas;
  2. Connections: é número total de conexões que já acontecerão desde o último restart;
  3. Max_used_connections: é o número de conexões simultâneas que acontecerão desde  o último restart.

Sendo assim, já temos um norte para trabalhar questões de escala de conexões com o MySQL. Já ouvi dizer sobre escalonador de threads e parâmetros de kernel do Linux, mas, a coisa pode ser mais simples que isso. As configirações atuais de um servidor que tenho monitorado são as seguintes:

mysql> show variables like 'max_connections';
+-----------------+-------+
| Variable_name   | Value |
+-----------------+-------+
| max_connections | 6000  |
+-----------------+-------+
1 row in set (0.00 sec)

mysql> show variables like 'max_user%';
+----------------------+-------+
| Variable_name        | Value |
+----------------------+-------+
| max_user_connections | 0     |
+----------------------+-------+
1 row in set (0.00 sec)

Com base nisso, passei a observar que quando as conexões atingiam o número de 1000 acontecendo de forma simultânea, ví que o valor da variável de status Aborted_Connects iniciava a aumentar freneticamente e  quando eu tentava acessar o MySQL via mysql client com qualuqer usuário, o seguinte mensagem de erro era enviada:

Can't create a new thread (errno 11); if you are not out of available memory, you can consult the manual for a possible OS-dependent bug

Ou seja, ou você está rodando o servidor de bancos de dados configurado com um valor de memória além daquele que o servidor tem disponível ou existe um bug no sistema operacional. Por eliminação, o servidor aonde roda este MySQL tem 64GB e está com 16GB sobrando. Então, esse problema tem havir com algo no sistema operacional. Pesquisando no internet, puder ver que outros amigos tiveram um cenário parecido e também criaram um blog sobre o assunto, como fez o amigo Dimitri em http://bit.ly/trVqL4.

Seguindo mais ou menos o que ele relatou nesse seu blog, eu tinha os memos parâmetros de ulimit para o usuário mysql (su – mysql), mas tinha um valor diferente para threads-max, um valor muito inferior ao mostrado por ele no blog, que é 2065067. Então foi assim que procedi:

  1. Configurei a qtd máxima de threads: echo “2065067” > /proc/sys/kernel/threads-max
  2. Configurei o arquivo “limits.conf” para as sessões dos usuários mysql e root:

mysql soft nofile 10240
mysql hard nofile 40960
mysql soft nproc 10240
mysql hard nproc 40960
root soft nofile 10240
root hard nofile 40960
root soft nproc 10240
root hard nproc 40960

A configuração número dois me pareceu muito familiar e foi bem aceita, pois, isso já é realizado quando se instala o Oracle Database. Após feito isso, foram realizados vários um testes de stress com o mysqlslap, biblioteca de benchmark do próprio MySQL e o problema persistia. Vários binários foram testados para verificar questões de escala entre uma versão e outra:

MySQL Oracle 5.5.17

mysqlslap: Error when connecting to server: 2001 Can't create UNIX socket (24)
mysqlslap: Error when connecting to server: 1135 Can't create a new thread (errno 11); if you are not out of available memory, you can consult the manual for a possible OS-dependent bug
mysqlslap: Error when connecting to server: 2001 Can't create UNIX socket (24)
mysqlslap: Error when connecting to server: 1135 Can't create a new thread (errno 11); if you are not out of available memory, you can consult the manual for a possible OS-dependent bug
mysqlslap: Error when connecting to server: 2001 Can't create UNIX socket (24)
Benchmark
Average number of seconds to run all queries: 4.117 seconds
Minimum number of seconds to run all queries: 4.117 seconds
Maximum number of seconds to run all queries: 4.117 seconds
Number of clients running queries: 1200
Average number of queries per client: 0

MySQL Oracle 5.0.92

mysqlslap: Error when connecting to server: 2001 Can't create UNIX socket (24)
Benchmark
Average number of seconds to run all queries: 3.049 seconds
Minimum number of seconds to run all queries: 3.049 seconds
Maximum number of seconds to run all queries: 3.049 seconds
Number of clients running queries: 1200
Average number of queries per client: 0

Percona Server 5.5.17

mysqlslap: Error when connecting to server: 2001 Can't create UNIX socket (24)
Benchmark
Average number of seconds to run all queries: 4.137 seconds
Minimum number of seconds to run all queries: 4.137 seconds
Maximum number of seconds to run all queries: 4.137 seconds
Number of clients running queries: 1200
Average number of queries per client: 0

Os testes acima foram realizados em uma mesma máquina com um arquivo de configuração padrão, somente com o valor de max_connections=6000 e max_user_connections=o.

[root@server mysql-coms]# my_print_defaults mysqld
--skip-external-locking
--port=3306
--socket=/var/lib/mysql/mysql.sock
--max_connections=6000
--max_user_connections=0

Uma saída lógica foi checar de mais de perto o erro “Error when connecting to server: 2001 Can’t create UNIX socket (24)” que poderia estar limitando a criação de mais threads, e por consequência mais usuários, no sistema operacional. Foi então que achei o MySQL Dojo aonde já haviam testado esses problemas e se baseavam no ulimit. Resumindo, explorar os valores configurados no ulimit, ou melhor, no arquivo limits.conf e aumentá-los até que os testes fossem satisfatórios. Então foi assim:

[root@server mysql-rpm]# ulimit -a mysql
core file size (blocks, -c) 0
data seg size (kbytes, -d) unlimited
scheduling priority (-e) 0
file size (blocks, -f) unlimited
pending signals (-i) 192031
max locked memory (kbytes, -l) 64
max memory size (kbytes, -m) unlimited
open files (-n) 90000
pipe size (512 bytes, -p) 8
POSIX message queues (bytes, -q) 819200
real-time priority (-r) 0
stack size (kbytes, -s) 90000
cpu time (seconds, -t) unlimited
max user processes (-u) 90000
virtual memory (kbytes, -v) unlimited
file locks (-x) unlimited

[root@server mysql-coms]# mysqlslap --user=root --auto-generate-sql --concurrency=1200 --number-of-queries=1
Benchmark
Average number of seconds to run all queries: 5.775 seconds
Minimum number of seconds to run all queries: 5.775 seconds
Maximum number of seconds to run all queries: 5.775 seconds
Number of clients running queries: 1200
Average number of queries per client: 0

E para provar que o MySQL está limitado somente pelo hardware ou ainda, neste caso, também pelas configurações do sistema operacional…

[root@server mysql-coms]# mysqlslap --user=root --auto-generate-sql --concurrency=2000 --number-of-queries=1
Benchmark
Average number of seconds to run all queries: 18.367 seconds
Minimum number of seconds to run all queries: 18.367 seconds
Maximum number of seconds to run all queries: 18.367 seconds
Number of clients running queries: 2000
Average number of queries per client: 0

[root@server mysql-coms]# mysqlslap --user=root --auto-generate-sql --concurrency=3000 --number-of-queries=1
Benchmark
Average number of seconds to run all queries: 41.411 seconds
Minimum number of seconds to run all queries: 41.411 seconds
Maximum number of seconds to run all queries: 41.411 seconds
Number of clients running queries: 3000
Average number of queries per client: 0

E assim, finalizo mais uma aventura com o MySQL e com missão cumprida! Até breve…


AddThis Social Bookmark Button

Cache de Threads – thread_cache_size

novembro 28th, 2011 | by: Bianchi | Posted in: MySQL Tuning | No Comments »

Um dos pontos mais críticos para o workload do MySQL é a criação contínua de threads e sabendo-se que a cada conexão que uma aplicação ou um cliente qualquer realiza com o MySQL, uma nova *thread* é criada – imaginem um servidor com essa quantidade de requisições:

mysql> \s
--------------
mysql Ver 14.14 Distrib 5.5.17, for Linux (x86_64)

Connection id: 100407
Current database:
Current user: root@localhost
SSL: Not in use
Current pager: stdout
Using outfile: ''
Using delimiter: ;
Server version: 5.5.17-log MySQL Community Server (GPL)
Protocol version: 10
Connection: Localhost via UNIX socket
Server characterset: latin1
Db characterset: latin1
Client characterset: utf8
Conn. characterset: utf8
UNIX socket: /var/lib/mysql/mysql.sock
Uptime: 8 days 17 hours 49 min 6 sec

Threads: 696 Questions: 292951068 Slow queries: 225 Opens: 498354
Flush tables: 1 Open tables: 256 Queries per second avg: 387.836
--------------

A saída do comando \s ou status acima nos mostra que temos 696 threads atualmente conectadas (ativas ou em sleep). O mais interessante é saber que através da variável thread_cache_size nós podemos solicitar que tais threads já criadas sejam limpas após uma desconexão e após isso, serem armazenadas em cache para reutilização. Assim, o MySQL não precisam mais criar novas threads a todo momento que uma nova conexão é requisitada. No exemplo abaixo, no mesmo servidor, aonde o número de conexões simultâneas batem em quase 1000, deixei o valor padrão de thread_cache_size configurado como 8, sendo um valor bem baixo para a demanda atual.

mysql> show variables like 'thread_cache%';
+-------------------+-------+
| Variable_name     | Value |
+-------------------+-------+
| thread_cache_size | 8     |
+-------------------+-------+
1 row in set (0.00 sec)

Mais uma vez, através das variáveis de status, podemos checar que o MySQL reutiliza o objeto thread para novas conexões:

mysql> show status like 'Thread%';
+-------------------+-------+
| Variable_name     | Value |
+-------------------+-------+
| Threads_cached    | 7     |
| Threads_connected | 799   |
| Threads_created   | 90435 |
| Threads_running   | 1     |
+-------------------+-------+
4 rows in set (0.00 sec)

mysql> show status like 'Thread%';
+-------------------+-------+
| Variable_name     | Value |
+-------------------+-------+
| Threads_cached    | 6     |
| Threads_connected | 799   |
| Threads_created   | 90435 |
| Threads_running   | 2     |
+-------------------+-------+
4 rows in set (0.00 sec)

Nos dois resultados acima, podemos ver que:

  • o número de threads em cache são 7, apontados por Threads_cached,
  • o número de threads conectadas é 799, o que mostra Threads_connected,
  • o número de threads já criadas desde a última reinicialização é de 90435,
  • o número de threads que atualmente tem o status diferente de Sleep, Threads_running.
Uma boa leitura para este cenário é, o número de Threads_cached diminuiu, já que uma das 7 threads que estavam em cache foi utilizada para uma nova conexão que agora está em um estado diferente de sleep (visto pelo SHOW PROCESSLIST). E o que mostra a otimização é justamente a reutilização da thread que estava em cache e a não crição de uma nova, já que o número de Threads_created não foi alterado. Você poderá otimizar o número de threads que você deseja armazenar no cache de threads do MySQL, área que é controlada pela variável thread_cache_size, através do arquivo de configuração do MySQL e setando um número próximo ao número de threads já criadas, apotando por Threads_created.
[mysqld]
thread_cache_size = 1000
Existe um problema em relação ao valor de thread_cache_size ser maior que 14 em versões anteriores à versão 5.5 do MySQL. Tenho alguns servidores de bancos de dados MySQL na versão 5.5++ em alguns clientes utilizando valores bem superiores, sem nenhum problema algum. O cache de threads poderá reduzir a pressão sobre o SWAP e o load de CPU, auxiliando o engine do MySQL a ocupar os recurso de máquina mais com outros problemas como a entrega de dados, por exemplo.
mysql> show status like 'Threads%';
+-------------------+-------+
| Variable_name     | Value |
+-------------------+-------+
| Threads_cached    | 273   |
| Threads_connected | 727   |
| Threads_created   | 4659  |
| Threads_running   | 101   |
+-------------------+-------+
4 rows in set (0.00 sec)
Até…
AddThis Social Bookmark Button

Analisando o InnoDB Buffer Pool

novembro 24th, 2011 | by: Bianchi | Posted in: MySQL Manutenção | No Comments »

A primeira coisa a se fazer ao se trabalhar com o InnoDB é utilizar as variáveis de status para checar se a configuração atual do Buffer Pool, definida em innodb_buffer_pool_size, satisfaz as necessidades dos bancos de dados atualmente armazenados no MySQL. Como já abordei aqui no blog, em outro post, manter os dados (e índices principalmente) em memória é a melhor opção para se obter boa performance de um banco de dados e no caso do MySQL + InnoDB não é diferente…

Selecione as variáveis de status que interessa…

mysql> show status like 'innodb_buffer_pool%';
+---------------------------------------+------------+
| Variable_name                         | Value      |
+---------------------------------------+------------+
| Innodb_buffer_pool_pages_data         | 392124     |
| Innodb_buffer_pool_pages_dirty        | 1          |
| Innodb_buffer_pool_pages_flushed      | 15949040   |
| Innodb_buffer_pool_pages_free         | 0          |
| Innodb_buffer_pool_pages_misc         | 1092       |
| Innodb_buffer_pool_pages_total        | 393215     |
| Innodb_buffer_pool_read_ahead_rnd     | 0          |
| Innodb_buffer_pool_read_ahead         | 8154       |
| Innodb_buffer_pool_read_ahead_evicted | 252        |
| Innodb_buffer_pool_read_requests      | 1444481964 |
| Innodb_buffer_pool_reads              | 7502       |
| Innodb_buffer_pool_wait_free          | 0          |
| Innodb_buffer_pool_write_requests     | 148957406  |
+---------------------------------------+------------+
13 rows in set (0.00 sec)

Como nesta instância não estou utilizando compressão de dados, as páginas de dados do InnoDB continuam com o valor padrão que é 16KB cada. Através da variável de status Innodb_buffer_pool_pages_data temos o número total de páginas atualmente dentro do Buffer Pool. Fazendo uma aritimética simples, Innodb_buffer_pool_pages_data*16KB, temos a quantidade em KB da quantidade de dados que preenche o buffer neste momento.

mysql> select (392124*16) pages;
+---------+
| pages   |
+---------+
| 6273984 |
+---------+
1 row in set (0.02 sec)

Transforme o resultado de bytes em giga:

mysql> select 6273984/1024/1024;
+-------------------+
| 6273984/1024/1024 |
+-------------------+
| 5.98333740        |
+-------------------+
1 row in set (0.00 sec)

E então compare a efetividade entre a quantidade de dados que estão dentro do buffer e o valor configurado para aquela área de memória:

mysql> select format(6273984/1024/1024,2) 'dadosNoBuffer',
-> format(@@innodb_buffer_pool_size/1024/1024/1024,0) 'valorConfigurado';
+---------------+------------------+
| dadosNoBuffer | valorConfigurado |
+---------------+------------------+
| 5.98          | 6                |
+---------------+------------------+
1 row in set (0.00 sec)

Vimos que o Buffer Pool está todo tomado por dados e, caso Innodb_buffer_pool_reads for maior que zero e Innodb_buffer_pool_pages_free for igual a zero, considere aumentar uma pouco o tamanho do Buffer Pool, uma vez que:

mysql> show status like 'innodb_buffer_pool%';
+---------------------------------------+------------+
| Variable_name                         | Value      |
+---------------------------------------+------------+
| Innodb_buffer_pool_pages_data         | 392123     |
| Innodb_buffer_pool_pages_dirty        | 1          |
| Innodb_buffer_pool_pages_flushed      | 15949040   |
| Innodb_buffer_pool_pages_free         | 0          |
| Innodb_buffer_pool_pages_misc         | 1092       |
| Innodb_buffer_pool_pages_total        | 393215     |
| Innodb_buffer_pool_read_ahead_rnd     | 0          |
| Innodb_buffer_pool_read_ahead         | 8154       |
| Innodb_buffer_pool_read_ahead_evicted | 252        |
| Innodb_buffer_pool_read_requests      | 1444481964 |
| Innodb_buffer_pool_reads              | 7502       |
| Innodb_buffer_pool_wait_free          | 0          |
| Innodb_buffer_pool_write_requests     | 148957406  |
+---------------------------------------+------------+
13 rows in set (0.00 sec)

Innodb_buffer_pool_reads -> leitura de dados do disco que não foram satisfeitas ao tentar ler dados do Buffer Pool, ou seja, os dados não estão lá por não haver mais espaço para armazená-los;

Innodb_buffer_pool_pages_free -> quantidade de páginas ainda disponíveis para armazenar dados no Buffer Pool;

Até…

AddThis Social Bookmark Button

InnoDB Buffer Pool

novembro 22nd, 2011 | by: Bianchi | Posted in: MySQL Manutenção | No Comments »

Os exemplos deste artigo contam com uma instalação completamente nova do MySQL, na versão 5.5.18, rodando em CentOS 6.0, conforme exibido abaixo:

[root@mgm01 ~]# rpm -ivh MySQL-server-5.5.18-1.rhel5.i386.rpm
Preparing...             ################################# [100%]
1:MySQL-server           ################################# [100%]
*** PLEASE REMEMBER TO SET A PASSWORD FOR THE MySQL root USER ***
[root@mgm01 ~]# rpm -ivh MySQL-client-5.5.18-1.rhel5.i386.rpm
Preparing...             ################################# [100%]
   1:MySQL-client        ################################# [100%]
[root@mgm01 ~]# rpm -ivh MySQL-shared-5.5.18-1.rhel5.i386.rpm
Preparing...             ################################# [100%]
   1:MySQL-shared        ################################# [100%]
[root@mgm01 ~]# cp /usr/share/mysql/my-large.cnf /etc/my.cnf
[root@mgm01 ~]# service mysql start
Starting MySQL.....                                      [  OK  ]
 

Muito se tem comentado e discutido sobre a utilização do InnoDB desde que a Oracle colocou no mercado a versão 5.5 do MySQL com o InnoDB Plugin, agora sendo este o Storage Engine padrão do MySQL. Antes disso, talvez fosse mais cômodo somente criar um banco de dados e um bando de tabelas e iniciar os projetos, mas agora, será necessário entender bem como funcionam algumas estruturas do InnoDB, já que as tabelas que você criava antes, agora serão controladas por um motor mais robusto, com integridade referencial, logs para suporte à transação, níveis de isolamento e muitos outros recursos que coloca o MySQL como uma opção robusta para ambientes de missão crítica. Neste post, vou tratar de explicar somente o funcionamento do Buffer Pool, área de memória criada e controlada pelo InnoDB, aonde são armazenados dados e índices de tabelas. Quanto mais dados destes tipos armazenados em memória, mais in-memory será o banco de dados e mais rápido será o trato com informações, seja para recuperação quanto para inserção/atualização de informação.

Em poucas palavras, o InnoDB Buffer Pool é uma estrutura que pode ser configurada através da variável innodb_buffer_pool_size e a quantidade de memória atribuída pode chegar a um número entre 70 e 80% da memória de um host. Na configuração de tal variável de ambiente, um cuidado deverá ser tomado para que esta área não fique grande demais e então seja mal aproveitada pelos dados que podem fragmentar internamente.

Alguns recursos valiosos para evitar tal desproporção ao configurar o InnoDB Buffer Pool são as variáveis de status e também a saída do comando SHOW ENGINE INNODB STATUS. Tanto um quanto o outro poderá orientar o administrador de bancos de dados a ajustar melhor o Buffer Pool. Abaixo, mostro uma parte muito importante da saída do comando SHOW ENGINE INNODB STATUS, que reporta toda a alocação de memória atual pelo InnoDB.

----------------------
BUFFER POOL AND MEMORY
----------------------
Total memory allocated 136806400; in additional pool allocated 0
Dictionary memory allocated 22706
Buffer pool size   8191
Free buffers       7884
Database pages     306
Old database pages 0
Modified db pages  0
Pending reads 0
Pending writes: LRU 0, flush list 0, single page 0
Pages made young 0, not young 0
0.00 youngs/s, 0.00 non-youngs/s
Pages read 0, created 306, written 316
0.00 reads/s, 0.00 creates/s, 0.00 writes/s
No buffer pool page gets since the last printout
Pages read ahead 0.00/s, evicted without access 0.00/s, Random read ahead 0.00/s
LRU len: 306, unzip_LRU len: 0
I/O sum[0]:cur[0], unzip sum[0]:cur[0]

Percebam que temos um dicionário de dados de 22706 bytes, 306 páginas de dados dentro do buffer que somam o tamanho total de 8191 bytes de dados e índices, não temos páginas modificadas e nem páginas antigas para serem despejadas (processo de “evicted”, veremos mais à frente). Além disso, não existem escritas pendentes, a LRU atual é também 0 e os contadores de read-ahead, o que também veremos à frente, estão zerados. Vou modificar um pouco estes dados, promovendo algum workload no InnoDB para motivar a sua percepção e vou pedir para que você interprete os resultados abaixo:

----------------------
BUFFER POOL AND MEMORY
----------------------
Total memory allocated 136806400; in additional pool allocated 0
Dictionary memory allocated 25579
Buffer pool size   8191
Free buffers       7735
Database pages     455
Old database pages 0
Modified db pages  0
Pending reads 0
Pending writes: LRU 0, flush list 0, single page 0
Pages made young 0, not young 0
0.00 youngs/s, 0.00 non-youngs/s
Pages read 0, created 455, written 650
0.00 reads/s, 0.00 creates/s, 0.00 writes/s
No buffer pool page gets since the last printout
Pages read ahead 0.00/s, evicted without access 0.00/s, Random read ahead 0.00/s
LRU len: 455, unzip_LRU len: 0
I/O sum[0]:cur[0], unzip sum[0]:cur[0]

Ainda falando a estrutura de armazenamento dos dados e índices de tabelas InnoDB em memória, internamente o Buffer Pool gerencia uma lista baseada no algorítimo LRU ou Least Recently Used (recentemente menos utilizado). Isso faz com os dados mais novos (chamados de “new” ou “young” sublist) sejam colocados na cabeça da lista e os dados mais antigos, e por consequência mais antigos, sejam posicionados na cauda (old sublist) – assim, os dados que não estiverem de acordo com essa lógica serão despejados da memória, cedendo espaço no Buffer Pool para novas entradas.

O registro da quantidade de páginas que foram despejadas sem serem utilizadas estão acessíveis através da variável de status Innodb_buffer_pool_read_ahead_evicted.

[root@mgm01 ~]# mysql -u root -p -e "show status like 'Innodb_buffer_pool_read_ahead%'\G"
Enter password:
*************************** 3. row ***************************
Variable_name: Innodb_buffer_pool_read_ahead_evicted
Value: 167

Segundo o manual online, 3/8 do Buffer Pool é destinado aos dados que pertencem à sublista de dados mais antigos, quando um novo dado chega ao buffer pool, el é inserido em um ponto denominado “midpoint” que é localizado na cabeça da sublista da cauda – isso é interessante pois uma operalçao qualquer iniciada pelo usuário poderá ler tal dado de maneira sequencial chamada read-ahead, que automaticamente realizada pelo InnoDB – o read-ahead é um tipo de leitura que poderá ser randômica, caso grande parte dos dados do tabelspace estiverem em memória ou sequencial quando o mecanismo descobre que os dados dentro de um mesmo segmento podem ser lidos todos de uma vez para a memória. Tal recurso de read-ahead poderá ser configurado através da variável global innodb_read_ahead_threshold.As páginas de dados que são modificados em memória são registrados no log buffer pool, que de tempos em tempos realiza um processo denominado “flush” que atualiza os dados do disco com os dados da memória, ou seja, tudo que foi modificado dentro do buffer pool, agora será gravado em disco. Este comportamento é gerenciado pelo InnoDB com base no valor configurado na variável de ambiente innodb_flush_log_at_trx_commit que tem como seus posíveis valores, os seguintes:

  • 0, os logs em memória são escritos em nos arquivos em disco uma vez a cada segundo, mas nada é feito no momento do COMMIT (este que é registrado no transaction log ao final de cada transação realizada com sucesso);
  • 1, os logs em memória são escritos nos arquivos em disco a cada COMMIT;
  • 2, os logs são escritos para os arquivos de log em disco a cada segundo e a cada COMMIT.

Em um ambiente de replicação, recomenda-se que que a variável innodb_flush_log_at_trx_commit seja configurada com o valor 1 e também sync_binlog seja igual a 1. Isso fará com que as alterações estejam armazenadas no log binário o mais breve possível para que esta seja entregue ao servidor SLAVE. Um outro fato que se deve tomar bastante cuidado é que, caso se configure tal variável igual o 0, dados poderão ser perdidos caso o sistema tenha um “crash” antes do próximo “flush”. Problemas poderão ser notados com o SHOW PROCESSLIST em transações que demoram para ser comitadas  dependendo da maneira como seu sistema foi implementado, a configuração desta variável igual a 2 e o MySQL Query Cache ativado – caso tenha um problema similar, além de me deixar saber (@wagnerbianchijr), desative o MySQL Query Cache e reinicie o MySQL. Ative o MySQL Profiling para verificar o que realmente esteja acontecendo:

mysql> SET profiling =1;
Query OK, 0 rows affected (0.08 sec)
mysql> SHOW PROFILES;
+----------+------------+-------------------------------------------------------------------------+
| Query_ID | Duration   | Query                                                                   |
+----------+------------+-------------------------------------------------------------------------+
|        1 | 0.00096100 | select name,id,competitions from olympic_games where host_city='Sydney' |
|        2 | 0.00029700 | SET GLOBAL query_cache_size=1024*1024*16                                |
|        3 | 0.00837900 | select name,id,competitions from olympic_games where host_city='Sydney' |
|        4 | 0.00009500 | select name,id,competitions from olympic_games where host_city='Sydney' |
+----------+------------+-------------------------------------------------------------------------+

O flush é um processo que conta também com um método, que é controlado pela variável innodb_flush_method, que poderá ser configurada com o valor O_DSYNC ou O_DIRECT, este último que é o mais indicado para ambientes com muita escrita pois evita uma escrita dupla dos dados no cache do InnoDB e no do Sistema Operacional. O_DSYNC é bom para realização de processos de restore, mas o swap poderá aumentar muito utilizando este método. Para medir o aumento do swap, você pode utilizar tanto o primo rico do top, o HTop ou o vmstat.

O Buffer Pool poderá ser configurado com o valor de mais de 4GB no caso de máquinas servidoras que tenham arquitetura 64 bits, sendo assim, uma novidade bem interessante que foi entregue com o MySQL 5.5 foi a possibilidade de particionar o Buffer Pool. A partir daquela versão você poderá criar, por exemplo, a seguinte configuração:

[mysqld]
innodb_buffer_pool_size = 64G # configurado em uma máquina com RAM total = 80GB
innodb_buffer_pool_instances = 10

Sendo assim, uma instância de MySQL com a configuração acima contará com 10 instâncias de Buffer Pool em memória, possibilitando armazenar o mesmo conjunto de dados, mas este conjunto dividido em pequenos subconjuntos que agiliza as operações com dados, sendo que cada uma das instâncias terá um tamanho de 6554MB ou 6.4GB.

Conclusão

Foi um artigo bem rápido, mas, é interessante falarmos sobre o mecanismo de buffer de dados do InnoDB, este que favorece as operações com dados já que mantém tudo ou quase tudo, na maioria dos casos, em memória. Uma vez que os seus dados forem armazenados na memória, a coisa já funcionará melhor.

AddThis Social Bookmark Button

Monitorando discos do servidor

novembro 16th, 2011 | by: Bianchi | Posted in: MySQL Manutenção | 1 Comment »

Pode ser que esse post não tenha haver com o fato de este ser um blog focado em MySQL, mas, pelo contrário, tudo que está em torno de tal software de bancos de dados será abordado aqui com foco na utilidade e melhor funcionamento. Levando em conta que alguns serviços em nuvem ainda oferecem serviços muito aquém daquilo que se espera, precisamos ter pró-atividade suficiente para monitorar hardwarede um servidor e principalmente, monitorar os discos, aonde reside a parte física dos bancos de dados – focando no MySQL – arquivos de dados ou tablespaces, logs de transações, logs binários, relay logs, general logs e logs de erro.

Muito interessante que você DBA entenda que todos estes arquivos são também parte necessária para o seu trabalho diário uma vez que:

  • Arquivo de Dados ou Tablespaces: como o MySQL tem sido mais utilizado ultimamente com o Storage Engine InnoDB, motor de armazenamento que possibilita a utilização de um ou mais arquivos de tablespace compartilhados com prefixo ibdataX (onde X é o número de sequência do nome do tablepace compartilhado) ou ainda com a configuração innodb_file_per_table que criará um tablepsace individual para cada tabela de um banco de dados. Uma falha dos discos poderá corromper os tablepsaces, sejam eles de quaisquer dos tipos citados acima, gerando um erro pareceido com este MySQL Bug # 18410.
  • Logs de Transações: estes arquivos (que por padrão são criados 2 após uma instalação padrão, id_logfile0 e ib_logfile1) são responsáveis por armazenar transações do InnoDB que receberam ou não um COMMIT. Utilizado principalmente para realizar, em conjunto com as áreas internas ao tablespace compartilhado (undo, redo e metadados), o processo de crash-recovery, eliminando do log todas as transações que não contam atualmente com um COMMIT e criando um checkpoint. Outros processo são realizados em conjunto (flush logs, escrita de dados…); tema para outro post.
  • Logs binários: estes arquivos podem ser utilizados como uma fonte muito ágil de extração de backup incremental, já que armazena tudo (STATEMENT ou ROW) que atualiza o estado dos bancos de dados. Além de ser uma ótima fonte para tal estratégia de backup, é obrigatoriamente utilizado para implementação de topologias de replicação entre dois ou mais servidores de bancos de dados MySQL.

Não vou citar a utilidade de todos os arquivos que foram mencionados na introdução deste post para não torná-lo cansativo, pois, o intuito aqui é você ter em mente que, além dos dados, que são a parte mais importante que qualquer outra, você ainda precisa monitorar os seus discos para que não existam surpresas, por exemplo, ao extrair backups com o mysqldump e este backup não contar com todos os dados pois o tablespace de uma tabela específica (geralmente a mais importante de todo o modelo físico) está com uma parte de seus dados corrompida. Isso pode acontecer. Uma outra surpresa é receber uma mensagem de erro de Assertion Thread Failure do inode do InnoDB ao tentar efetuar o CHECKSUM dos dados e não ter conseguido -esse é um dos problemas que uma intermitência nos discos poderá gerar.

98% das falhas atualmente detectadas com tablepace do InnoDB estão relacionadas com hardware mal provisionado, banco de dados mal configurado em relação ao desempenho e a pressão sobre memória secundária, o que implica em muito mais trabalho de disco e CPU e menos da memória (quando deveria ser ao contrário). A utilização intensa de disco e CPU gera overhead e, consequentemente, lentidão.

Mas como fazer para monitorar possíveis problemas com os discos do meu servidor?

Tenho utilizado muito o S.M.A.R.T. com o smartctl e o smartd com que são respectivamente o utilitário e o daemon para verificação contínua da saúde dos discos de um servidor, seja ele crítico ou não. Indenpendente da criticidade, é muito importante que se tenha um pleno monitoramento, pois, o hardware também poderá nos deixar na mão e parar o acesso à informação.

O smartd é o daemon, sendo assim, ele precisa estar rodando para que possamos interagir com o mesmo e gerar os resultados que buscamos ao monitorar os discos de um servidor. O comando cliente é o smartctl que poderá ser utilizado das seguintes formas:

[root@redhat01 ~]# smartctl -i /dev/sda3
smartctl 5.39.1 2010-01-28 r3054 [x86_64-redhat-linux-gnu] (local build)
Copyright (C) 2002-10 by Bruce Allen, http://smartmontools.sourceforge.net

=== START OF INFORMATION SECTION ===
Device Model: WDC WD1003FBYX-01Y7B0
Serial Number: WD-WCAW32441497
Firmware Version: 01.01V01
User Capacity: 1,000,204,886,016 bytes
Device is: Not in smartctl database [for details use: -P showall]
ATA Version is: 8
ATA Standard is: Exact ATA specification draft version not indicated
Local Time is: Wed Nov 16 14:40:28 2011 CST
SMART support is: Available - device has SMART capability.
SMART support is: Enabled

O comando mostrado acima nos permite verificar o modelo e o firmware do disco /dev/hda. O SMART mantém um database com vários modelos de disco e possivelmente o seu esteja neste database será reconhecido.

Você pode verificar o conteúdo deste database com o seguinte comando (resultados suprimidos):
[root@redhat01 ~]# smartctl -P showall
...
MODEL REGEXP: QUANTUM FIREBALL EX(3.2|6.4)A
FIRMWARE REGEXP: .*
MODEL FAMILY: Quantum Fireball EX series
ATTRIBUTE OPTIONS: None preset; no -v options are required.

MODEL REGEXP: QUANTUM FIREBALL ST(3.2|4.3|4300)A
FIRMWARE REGEXP: .*
MODEL FAMILY: Quantum Fireball ST series
ATTRIBUTE OPTIONS: None preset; no -v options are required.

MODEL REGEXP: QUANTUM FIREBALL SE4.3A
FIRMWARE REGEXP: .*
MODEL FAMILY: Quantum Fireball SE series
ATTRIBUTE OPTIONS: None preset; no -v options are required.

MODEL REGEXP: QUANTUM FIREBALLP LM(10.2|15|20.[45]|30)
FIRMWARE REGEXP: .*
MODEL FAMILY: Quantum Fireball Plus LM series
ATTRIBUTE OPTIONS: None preset; no -v options are required.

MODEL REGEXP: QUANTUM FIREBALLP AS(10.2|20.5|30.0|40.0)
FIRMWARE REGEXP: .*
MODEL FAMILY: Quantum Fireball Plus AS series
ATTRIBUTE OPTIONS: None preset; no -v options are required.

MODEL REGEXP: QUANTUM FIREBALLP KX27.3
FIRMWARE REGEXP: .*
MODEL FAMILY: Quantum Fireball Plus KX series
ATTRIBUTE OPTIONS: None preset; no -v options are required.

O segundo comando é o mais interessante, pois, possibilita criar um relatório mais completo que lista pontos importantes relacionados com a saúde do disco analisado. É conhecido como “Executive Summary of Disk Health” – o relatório abaixo mostra que o disco foi aprovado e não existem falhas, mas, caso o relatório te mostre o contrário, faça o backup de seus dados imediatamente.

[root@redhat01 ~]# smartctl -Hc /dev/sda3
smartctl 5.39.1 2010-01-28 r3054 [x86_64-redhat-linux-gnu] (local build)
Copyright (C) 2002-10 by Bruce Allen, http://smartmontools.sourceforge.net

=== START OF READ SMART DATA SECTION ===
SMART overall-health self-assessment test result: PASSED

General SMART Values:
Offline data collection status: (0x84) Offline data collection activity
was suspended by an interrupting command from host.
Auto Offline Data Collection: Enabled.
Self-test execution status: ( 0) The previous self-test routine completed
without error or no self-test has ever
been run.
Total time to complete Offline
data collection: (16500) seconds.
Offline data collection
capabilities: (0x7b) SMART execute Offline immediate.
Auto Offline data collection on/off support.
Suspend Offline collection upon new
command.
Offline surface scan supported.
Self-test supported.
Conveyance Self-test supported.
Selective Self-test supported.
SMART capabilities: (0x0003) Saves SMART data before entering
power-saving mode.
Supports SMART auto save timer.
Error logging capability: (0x01) Error logging supported.
General Purpose Logging supported.
Short self-test routine
recommended polling time: ( 2) minutes.
Extended self-test routine
recommended polling time: ( 170) minutes.
Conveyance self-test routine
recommended polling time: ( 5) minutes.
SCT capabilities: (0x303f) SCT Status supported.
SCT Feature Control supported.
SCT Data Table supported.

Percebam que o primeiro atributo é mesmo aquele que indica que o disco PASSOU no teste do SMART.

Referências:

Tags: , , , , , , ,

AddThis Social Bookmark Button

Manutenção do MySQL – mysqlcheck

novembro 13th, 2011 | by: Bianchi | Posted in: MySQL Manutenção | No Comments »

Uma das tarefas mais interessantes e que envolve mais pontos a serem analisados são as rotinas de manutenção dos bancos de dados e com o MySQL não é diferente. Tais pontos vão da análise do melhor momento para se realizar tal manutenção, intervalo de tempo denominado “janela de manutenção” ou do inglês, “maintenance time frame” , o tempo que tal rotina levará para completar o trabalho e quais são os objetivos de tal ação, esta que pode resultar em vários ganhos para o ambiente, seja de performance, seja de backup ou mesmo de prevenção contra desastres.

Comummente, não é muito racional simplesmente colocar um script qualquer no cron do Linux ou agendador de tarefas do MS Windows e deixar este ser executado de acordo com o agendamento. Interessante que você, administrador de bancos de dados, saiba exatamente o que realizar em detrimento de cada objetivo que você tem em relação à manutenção dos seus bancos de dados – é uma ilusão achar que os dados não fragmentarão com o tempo, que dados não serão corrompidos nunca e que, principalmente, você não precisará de um backup, aquele que falhou esta manhã. Muito cuidado com este último tópico e lembre-se, Murphy e sua lei estão sempre aonde existem “pontos simples de falha (SPOF)”.

O MySQL nos dá várias possibilidades de se trabalhar a manutenção de tabelas de qualquer Storage Engine através do *programa-cliente mysqlcheck, que é adicionado ao PATH do sistema operacional após a instalação do MySQL Server. Tanto em sistemas Unix Like quanto em sistemas MS Windows, ao utilizar o terminal ou o prompt de comando, respectivamente, basta teclar as primeiras letras e utilizar TAB para completar o nome do aplicativo, que, logo você perceberá que vários outros aplicativos, além do mysqlcheck, também estão disponíveis. Após ser chamado na linha de comando, como se trata de um programa-cliente, você precisará apontar qual usuário/senha para se conectar ao servidor de bancos de dados MySQL (mysqld), quais bancos de dados e quais as opções, estas que são várias as disponíveis.

Sintaxe de utilização do mysqlcheck:

shell> mysqlcheck [options] db_name [tables]
shell> mysqlcheck [options] --databases DB1 [DB2 DB3...]
shell> mysqlcheck [options] --all-databases

Checagem de Erros – opção “-c”

O mysqlcheck poderá ser utilizado com a opção “-c” para checar os possíveis erros em tabelas de qualquer Storage Engine. Você pode programar algo em shell script para pegar os erros e lhe enviar por e-mail ou acompanhar a execução do programa via linha de comando. Após a checagem, caso algum erro seja reportado, é interessante verificar qual é a tabela e em qual banco de dados está para que as ações de correção possam ser realizadas, o que varia de acordo com o Storage Engine.

Checando erros em todos os bancos de dados:

shell> mysqlcheck [options] --all-databases -c

Atualizando Estatísticas – opção “-a”

Atualizar estatísticas é uma operação essencial em bancos de dados! Normalmente, é interessante que os objetos, índices e linhas de tabelas sejam estatisticamente computadas para que a primeira camada do MySQL, aonde residem os módulos de otimização de consultas (transformação e criação de plano de execução), para que a melhor rota seja traçada com base em tais estatísticas – resumidamente, eu sei quantas linhas, em índices ou não, eu tenho que percorrer de acordo com uma estratégia definida para atender a uma consulta. No caso de consultas que envolvem JOIN, a ordem das tabelas é definida através das estatísticas.

Se eu não sei a quantidade de objetos, índices e linhas que tenho em disco nos arquivos em disco, como farei essa decisão? A atualização das estatísticas garante que haja consistência entre a visão lógica (engine) e física (arquivos em disco) dos bancos de dados.

O mysqlcheck -a ou –analyze é equivalente ou ANALYZE TABLEsão comando equivalentes e ao serem executados, adquirem bloqueio de leitura (bloqueio compartilhado) e funcionando para tabelas MyISAM e InnoDB.

Analisando as tabelas em todos os bancos de dados:

shell> mysqlcheck [options] --all-databases -a

Otimizando tabelas – opção “-o”

A opção “-o” otimiza os dados em disco promovendo melhor alocação dos dados dentro de suas respectivas páginas de dados em disco, assim como promove, consequentemente, a desfragmentção de toda a informação armazenada. Além disso, atualiza as estatísticas de índices fazendo a ordenação dos mesmos (InnoDB Clustered Indexes) e o rearranjo da árvore B-TREE (MyISAM e InnoDB). Durante a operação, um bloqueio exclusivo será adquirido na tabela na qual o processo está rodando (bloqueio exclusivo = WRITE LOCK) e o poder de resposta do servidor de bancos de dados poderá diminuir muito nesse momento. Após o processo, caso seja uma base que tem alterações intensas em seus registros, poderemos perceber diminuição dos espaço consumido em disco pelos bancos de dados.

Otimizando as tabelas em todos os bancos de dados:

shell> mysqlcheck [options] --all-databases -o

A partir da versão 5.1 do MySQL, o InnoDB Plugin passou a não se entender muito bem com o OPTIMIZE TABLE ou a opção “-o” do mysqlcheck. Ao rodar um daqueles comandos contra uma tabela que é controlada pelo Storage Engine InnoDB Plugin, o seguinte erro será enviado ao usuário:

Table does not support optimize, doing recreate + analyze ...

Este tipo de problema poderá ser contornado através do recriação da tabela com o que chamamos de REBUILD, seguido por um ANALYZE, isso para todas as tabelas do banco de dados:

mysql> ALTER TABLE nome_tabela ENGINE=InnoDB;
mysql> ANALYZE TABLE nome_tabela;

Lembro que você poderá montar os comandos para todas as tabelas do banco através de scripts ou mesmo, utilizando SQL em conjunto com a tabela TABLES do dicionário de dados do MySQL, o INFORMATION_SCHEMA.

Tais operações de manutenção podem agora fazer parte do seu plano de otimização para o MySQL e você poderá desenvolver um script para isso utilizando shell ou DOS. Problemas com crash de tabelas e performance poderão ser detectados e resolvidos com o aplicativo mysqlcheck. Basta agora, conceber um plano com padrões para todas as ações que serão realizadas, estudar o padrão de nomenclatura, contar com um profissional especializado para assinar o projeto e colocar em execução. Assim, sua tecnologia tem bem menos chances de ter problemas quando mais se precisar dela.

AddThis Social Bookmark Button

Little comments about InnoDB

novembro 8th, 2011 | by: Bianchi | Posted in: MySQL A&D | No Comments »

Hello everyone, here we go for a new blog post and now treating about InnoDB inside MySQL 5.5 and as you should now, this new version uses InnoDB Plugin version 1.1 which one has a lot of new adjustable resources. What most caught my attention was the impressed way that users could adjust it to have a lot more performance than MyISAM, for example. It was benchmarked here.

At the beginning, when Oracle announced about the new default Storage Engine (InnoDB, bingo!), many users were scared and started to ask about why is that change really necessary. Many other users just nod heads for it and now we have a good proof of this necessity – to have more scalesecurityand reliability.

Scale [Up] because the data could be compressed to use more memory and processor than disk (it avoid overhead), more transactions could be started concurrently and more CPU cores can be addressed as MySQL 5.5.4 is better prepared now to scale up to 32 cores. You can read about it accessing DimitriK’s (dim) Weblog.

innodb_more_cores

Security is noted when you compare InnoDB with MyISAM because with InnoDB you will have good performance with safe and crash recovery, using transactions logs and data and indexes inside a tablespace, what will improve besides security, availability too.

I remember you to use new file format (innodb_file_format) configured as Barracuda in order to provide all new functionality to your environment. Unlike MyISAM, InnoDB has its own transaction logs which by default are created inside DATADIR (normally at /var/lib/mysql). If you specify no InnoDB configuration options, an auto-extending 10MB datafile named `ibdata1'and two 5MB log files named `ib_logfile0' and `ib_logfile1' in the MySQL data directory – DATADIR. As long as a transaction receives a COMMIT or a ROLLBACK, a checkpoint is created, transaction is registered or rolled back and the life goes on.

The InnoDB’s behavior at this point will depend on some interesting configurations: innodb_log_buffer_size (to maintain transactional data into the log buffer), innodb_max_dirty_pages_pct (the percentage of dirty pages can remain into the buffer pool), innodb_flush_log_at_trx_commit (the way data will be flushed to disc, it accepts values from 0 to 2), and innodb_flush_method, that may decide how to open files and flush all dirty pages have been modified since last flush process.

The InnoDB parameterization have been showing that we have lots of combination to have more performance in certain conditions.  When you’re about to restore large databases, it’s good to have innodb_flush_method=O_DSYNC although it will increase swap as much as possible. To have good performance on restoring a database make sure to disable unique and foreign key checks, configure autocommit appropriately and create a backup with “-e” option (when use mysqldump).

You can use the following variables to handle InnoDB configuration and behavior:

[mysqld]

# innodb file new features configuration
innodb_file_per_table = BARRACUDA # it will "turn on" all InnoDB Plugin new features
innodb_file_per_table = 1 # it will "turn on" a tablespace file per database table

# innodb log file configuration
innodb_log_group_home_dir=/var/log/mysql/innodb # where files will end up
innodb_log_files_in_group=8 # the amount of log files current instance will have
innodb_log_file_size=500M # the total of innodb_files_in_group * innodb_log_file_size can't be greater than or equal to 4096M - 4G

# innodb log buffer configuration - tinkling about a circle per created log file before flushing process
innodb_log_buffer_size=1024M # considering an environments with large transactions, making this variable large will save disk I/O, click here to know more how to calculate it better
innodb_flush_method=O_DIRECT # avoid OS Buffer Cache and too much RAM dedicated to it
#

Reliability cause these all features together to deliver good set of subsystems to have good performance, what can be achieved using innodb_file_per_table to create a tablespace file per table, less I/O in this case, the capacity to compress data using less space into tablespace segments, expends less extents and fit memory with more data.

A good touch, on broad terms is that InnoDB can be configured to use external disks as SAN or other machines to storage its structure and data. Using certain variables you can, for example, put InnoDB files on another disks to get more performance. These below variables will become it possible:

[mysqld]
innodb_data_home_dir  = /nfs1/innodb
innodb_data_file_path = /ibdata/ibdata1:50M;/ibdata/ibdata2:50M:autoextend

Following good practices, it is really important whether you can to separate data and transaction logs onto different disks.

AddThis Social Bookmark Button

Compressão de dados entre Storage Engines

novembro 8th, 2011 | by: Bianchi | Posted in: MySQL A&D | No Comments »

Muitos são os problemas quando se tem uma empresa que utiliza qualquer um dos produtos de bancos de dados existentes no mercado e não libera os investimentos necessários em estrutura, sendo a questão relacionada a falta de espaço em disco um dos maiores incidentes ocorridos em bases de dados. Com isso, já que não há recursos para que os discos sejam expandidos ou mesmo, um espaço em cloud seja disponibilizado, o administrador de bancos de dados deverá se munir de competência necessária para analisar a base de dados e utilizar a melhor compressão de dados que um dentre todos os storage engines nativos do MySQL apresenta. Estou introduzindo este post para falar sobre o Archive Storage Engine.

Tenho um cliente em especial que tem uma grande base de dados para atender a um sistema de work-flow, ou seja, este sistema armazena dados em um banco de dados localizado em uma instância do MySQL, sendo que, temos lá várias tabelas de movimentação de dados e outra que recebem somente INSERT e SELECT – ESCRITA e LEITURA – que são dados de parametrização e programação da produção das várias esteiras aonde os insumos de produção são encaixados no similar para que este se torne ao final, um produto acabado. Bom, sem este parâmetros, o sistema não consegue, então, filtrar as requisições dos produtos que devem ser mais ou menos produzidos e as suas características. Estas tabelas que recebem somente o INSERT de dados, todos os dias são alimentadas pela programação de produção realizada pelos engenheiros e assim por diante.

Pensando em economizar espaço, já que os discos não poderiam ser adquiridos neste momento (acho que nem tão cedo), pensei que poderíamos pegar as tabelas de parâmetros de produção – que representam 38% do espaço em disco alocado para dados e índices – e transformá-las de InnoDB para Archive, mas não tinha noção do quanto tais tabelas poderiam ter seus dados comprimidos. Assim, realizei o seguinte teste:

1-) Criei um tabela tb_innodb com uma coluna id do tipo INT, controlada pelo engine InnoDB;

2-) Criei um tabela tb_myisam com uma coluna id do tipo INT, controlada pelo engine MyISAM;

3-) Criei um tabela tb_archive com uma coluna id do tipo INT, controlada pelo engine Archive;

4-) Criei uma stored procedure para dar carga de 1.000.000.000.000 de linhas nas tabelas criadas;

Ao final, eu tinha como consultar o INFORMATION_SCHEMA, utilizando as informações da tabela TABLES para verificar o tamanho de dados e das duas tabelas e comparar os resultados com foco na compressão de ambos os engines. O resultado foi o seguinte:

Veja que, enquanto os dados recuperados em megabytes de uma tabela InnoDB tem um tamanho de pouco mais de 30MB, uam tabela com o mesma quantidade de dados, mas controlada pelo Storage Engine Archive tem menos de 10% daquele tamanho. Coloquei a tabela MyISAM no meio deste teste somente para ter também uma noção do seu nível de compressão. Assim, conseguimos liberar grande quantidade de espaço em disco para tabela que sofrem somente SELECT e INSERT.

Atenção: tabelas Archive somente aceitarão SELECT e INSERT, outros comandos falharão!

AddThis Social Bookmark Button

Starting with MySQL Cluster

novembro 8th, 2011 | by: Bianchi | Posted in: MySQL HA | No Comments »

MySQL Cluster originates from a product called Network DataBase from Ericson Telco, located on Swedish.  Ericson’s intention was to have a database running on network as a service. Today’s MySQL Cluster have its name NDB due to the original technology name. For example, the name of the Storage Engine used connected to MySQL Server is NDB (instead of InnoDB or MyISAM). IN general, whether you see NDBCLUSTER, you can think of it as “MySQL Cluster”.

Usually we have many parts involved in a cluster technology and in MySQL Cluster it isn’t different. MySQL Cluster implements three node’s kind to achieve the objective to have no SPOF (Single Point Of Failure) and eliminate downtime possibilities in order to have data available for more time. Besides, the automatic fail over processes happens on a regular basis when some of nodes crash in the middle of operations. Well, there are:

  • Management Node: this node have its function to serve environment as a management. The client program called ndb_mgm connects with its daemon called ndb_mgmd and can be used to retrieve information about other connected cluster nodes and execute some services as cluster backup, for example;
  • Storage Data (or Data Node): connected with management, these nodes are the cluster’s storage that will be used to retrieve data from databases. I strongly recommend start a new MySQL Cluster with at least two data nodes (four is better);
  • API Node (or SQL Node): this node is responsible for receive all external interaction (SQL commands) and manipulates data on storage nodes.

After to understand better what is each presented cluster node, we need to know how to start a configuration of a simple MySQL Cluster, what is the hottest topic of this article. Due to MySQL Cluster has its architecture shared-nothing based, e.g., each component has its own hardware and structure, we must initiate this “simple” project using some virtual machine software (I am using Oracle VirtualBox) to create at least five machines which will have name’s node at hostname, firewalls disabled, SELinux disabled and a static network IP. I am using CentOS 5.5 as operating system and MySQL Cluster 7.1.9.

The first step is configure out the node1 what I set up as Management Node, the node what will serve to retrieve all information about all other cluster nodes and execute services as a backup, start and restart nodes. During its machine operating system installment, you must ensure that all firewalls and SELinux were disabled (MySQL Cluster have problems with firewalls because they need use a couple of it). Configure OS static IP and download MySQL-cluster-gpl-management-xxxxx-rhel-x86-64.rpm and MySQL-cluster-gpl-tools-xxxxx-rhel-x86-64.rpm. After it, we’ll log on linux terminal as a root, create new directory named mysql-cluster under /usr/local and move files from Download directory (I am using firefox with default configuration) to /usr/local/mysql-cluster. We need to create the DataDir where will be found ndb_mgmd log files.

[ root@node1 ~ ] mkdir -p /usr/local/mysql-cluster
[ root@node1 ~ ] mkdir -p /var/lib/mysql-cluster
[ root@node1 ~ ] mv /home/bianchi/Desktop/Downloads/MySQL-* /usr/local/mysql-cluster
[ root@node1 ~ ] cd /usr/local/mysql-cluster

After to download right MySQL Cluster files to apply on Management Node, we need to create the MySQL Cluster configuration file (using your preferred text editor). This file will be located at /usr/local/mysql-cluster/ and its name will be config.ini.

[ root@node1 mysql-cluster ] pwd
/usr/local/mysql-cluster
[ root@node1 mysql-cluster ] vim config.ini

# Into this file we’ll put all configurations required to all nodes. Look for a comments that I’ll use # into this file (commands are used after # signal).

[ndb_mgmd]
#
# Configurations used to control ndb_mgmd behavior
#
NodeId=1
HostName=192.168.0.101
DataDir=/var/lib/mysql-cluster

[ndb_default]
#
# Configurations that will be inherited for all storage/data node
#
DataDir=/var/lib/mysql-cluster
NoOfReplicas=2

[ndb]
# registering new storage node
NodeId=3
HostName=192.168.0.102

[ndb]
# registering new storage node
NodeId=4
HostName=192.168.0.103

[mysqld]
# registering new API/SQL node
NodeId=11
HostName=192.168.0.104


[mysqld]
# registering new API/SQL node
NodeId=12
HostName=192.168.0.105

Save and close config.ini file. This file contain configurations to start up a MySQL Cluster with 1 management node, 2 storage nodes and 2 SQL nodes. Now, we will proceed with the management node software installation. As we are working with rpm package, we need only a command to install all MySQL packages located at /usr/local/mysql-cluster.

[ root@node1 mysql-cluster ] rpm -ivh MySQL-*
Preparing... #################################### [100%]
1:MySQL-Cluster-gpl-management ################## [100%]
2:MySQL-Cluster-gpl-tools ####################### [100%]
[ root@node1 mysql-cluster ]

After install, start ndb_mgmd indicating previous crated config.ini file:

[ root@node1 mysql-cluster ] pwd
/usr/local/mysql-cluster
[ root@node1 mysql-cluster ] ndb_mgmd --config-file=config.ini
MySQL Cluster Management Server mysql-5.1.51 ndb-7.1.9
[ root@node1 mysql-cluster ]

We can use $? shell variable to check if some error was rose when we started ndb_mgmd:

[ root@node1 mysql-cluster ] echo $?
0
[ root@node1 mysql-cluster ]

Shell $? variable can return the possible errors below:

0 -> no errors during last script execution, e.g., execution success
1 -> an unknown error occurred
2 -> an command into script error was detected
127 -> some nonexistent command was entered and rose an error

As you can see, our Management Node is up & running at this time and we can issue some commands to list all cluster’s node members. Type just ndb_mgm to use this client to connect with ndb_mgmd and retrieve information, as you see below:

[ root@node1 ~ ] # ndb_mgm
-- NDB Cluster -- Management Client --
ndb_mgm> SHOW
Cluster Configuration
---------------------
[ndbd(NDB)] 2 node(s)
id=3 (not connected, accepting connect from 192.168.0.101)
id=4 (not connected, accepting connect from 192.168.0.102)

[ndb_mgmd(MGM)] 1 node(s)
id=1 @192.168.0.100 (mysql-5.1.51 ndb-7.1.9)


[mysqld(API)] 4 node(s)
id=11 (not connected, accepting connect from 192.168.0.103)
id=12 (not connected, accepting connect from 192.168.0.104)

Naturally, as you can see above, we don’t have any nodes connected but management node. Now we have completed the first part of five job’s parts. Next I’ll register here how to configure Storage/Data Nodes to start it connecting the Management Node.

See you.

AddThis Social Bookmark Button

MySQL Cluster Storage Nodes

novembro 8th, 2011 | by: Bianchi | Posted in: MySQL HA | No Comments »

Going on with our MySQL Cluster studies, now I am starting this new post to talk or write about the Storage or Data Nodes, that one is responsible to storage all cluster data. When we start a cluster (as you have read at MySQL Cluster First Topics), the first step is to start the Management Node and the second part is to start the storage nodes, responsible to storage data using NDBCLUSTER Storage Engine. Normally, the correct, stated and desired form to have nodes to support storage node is to concept a separate machine in order to have only ndbd process using that machine resources. It is important cause, if data node or its daemon named ndbd do not have enough memory to maintain at least indexes on memory, it will crash and will not function properly. But, we will treat about this little things most ahead in order to introduce first steps to concept a data node, start and be happy with you cluster!

After to chose what machines or boxes will be the cluster storage nodes, paying attention about the configurations as the same model of CPU, same amount of memory and the most important part, concept a full 64-bit machine, including OS, hardware and softwares, we can start to download MySQL Cluster Storage Node software component in order to install correct packages and configure it to connect with Management node. Remember, all hardware involved must be the same configuration in order to avoid performance problems and keep the cluster simple as much as you can (normally, I have been implementing MySQL Cluster using Virtual Machines in order to have the max proximity of hardware configuration – the problem is, we must have a look on SPOFS, or, single point of failure). To build Storage Nodes, it will be required to download two packages:

  • MySQL-Cluster-gpl-tools-7.x.x-x
  • MySQL-Cluster-gpl-storage-7.x.x-x

As I am using CentOS 5.5 to write this post, I have downloaded “.rpm” packages that will be installed using rpm package manager at terminal linux level. You can apply this post on MS Windows, for example and install execs packages as you want. Below, I will demonstrate the install process:

[ root@node3 ]# rpm -ivh MySQL-*
Preparing... ############################################ [100%]
1:MySQL-Cluster-gpl-tools ################################## [100%]
2:MySQL-Cluster-gpl-stora ################################## [100%]
[ root@node1 ]#

After this, we can use the files cluster concepts, what is the local files and global files! Local files is that files that is created locally on the node’s machine and will serve to configure the cluster Storage Nodes connectstring (ndb_connectstring variable or its shortcut “-c” can be used on local files or by passing through command line). A good touch is, when you are using local files, you will able to inform just little things that will be applied on Storage Nodes connection with Management Nodes. As we have necessary components installed at this moment, we must create a configuration file that one will be read when ndbd starts (you can query where is the default location that ndbd will read local files using ndbd –help and on the command line and reading the firsts lines). The local file will be created below on the example:

[ root@node3 ]# vim /etc/my.cnf


# my.cnf local file
# storage node's configuration
#
[ndbd]
ndb-connectstring=192.168.1.100:1186
# finish

Before I forget, the cluster configuration global file is that just one we have created on the first post, that one the majority of the configurations were mentioned and resides on the Management Node. There, we can mention that configurations that will be applied on all Storage Nodes using the section [ndbd default].

Now, you can simply call ndbd on the command line and it will read cluster configuration local file in order to know the exact location of the Management Node (ndb_mgmd) and initiate your tests though the normal levels before appear as started on ndb_mgm Management client. Remember that the location where you can check about all nodes are running is the ndb_mgm client on Management Node (if you are using two Management Nodes – this is good, what a wonderful thing! – you can use both to retrieve all cluster status information).

Calling ndbd on the command line:

[ root@node3 ]# ndbd
2011-03-25 13:21:13 [ndbd] INFO -- Angel connected to '192.168.1.100:1186'
2011-03-25 13:21:13 [ndbd] INFO -- Angel allocated nodeid: 3

As you can see, after start the ndbd process, two processes were started together, one is the ndbd Storage Node and another is the ndbd Angel, the process tha will rise up main Storage Node process in case it going down. The started Storage Node received its NodeID as previously configured and now is waiting the other nodes to finish its complete start! All Storage Nodes envolved on the MySQL Cluster must pass through the same process – installation components, creation of configuration file mentioning the ndb_connectstring under [ndbd] section and start of ndbd. After to complete these jobs on all cluster storage nodes, go to the Management Node and query for the nodes status using ndb_mgm client as mentioned below:

[ root@node1 ~ ] # ndb_mgm -e "SHOW"
-- NDB Cluster -- Management Client --
Cluster Configuration
---------------------
[ndbd(NDB)] 2 node(s)
id=3 @192.168.1.103 (mysql-5.1.51 ndb-7.1.10, NodeGroup: 0, Master)
id=4 @192.168.1.104 (mysql-5.1.51 ndb-7.1.10, NodeGroup: 0)

[ndb_mgmd(MGM)] 1 node(s)
id=1 @192.168.0.100 (mysql-5.1.51 ndb-7.1.9)

[mysqld(API)] 4 node(s)
id=11 (not connected, accepting connect from 192.168.0.103)
id=12 (not connected, accepting connect from 192.168.0.104)

See ya.

AddThis Social Bookmark Button

MySQL Replication Topologies

novembro 8th, 2011 | by: Bianchi | Posted in: MySQL Replication | No Comments »

You should know that MySQL team has been doing a good job and that product naturally is being a great option when the chat is horizontal scale or Scale-Out too. I mentioned the last “too” cause MySQL has been doing a so confident job in vertical scaling on its availability with hands on InnoDB Storage Engine. But, treating about MySQL Replication and Scale-Out points, MySQL has its good features as that three supported kinds of data replication:

  • Synchronous data replication, used just when you’re using MySQL Cluster (data replication between Data Nodes);
  • Asynchronous and Semi-synchronous replication, to replicate data using servers available as a MASTER and SLAVE, having MASTER a lot of SLAVEs and a SLAVE a unique MASTER.
This post are being write just to highlight the kinds of topology mentioned by Oracle and some other that we can create to solve a specific problem inside a company. To mention the existent kinds, it will need to explain more about the “map of availability”, created by MySQL AB.
As say a friend from USA, it is “easy peasy”  to understand this graph and work with on your organization strategy. Starting from Small Business where normally a little and small amount of availability is required to maintain the business continuity, you can set up just only a instance of MySQL to get it working well, with small management applied to this environment. We can realizing, looking graph that this small business could count with 35 days of downtime on worst cases. As we will rising the graph, we will seeing new situations and the number of nines will growing (high availability nines).
.
Topology 1: Single
.
The fist one I will comment is the “Simple” topology, normally used when organization is looking for data redundancy and backup process improvements. Simply, it will operates with two servers actuating as a MASTER and SLAVE. The good touch here is to adapt application to write data on MASTER and just read data from SLAVE. It will provide good improvements and will alleviate workload if you were operating with a single server to respond all app requests .

master-slave

The main server (rounded with red) acts as a MASTER and the other, as a SLAVE - that last must be configured with read-only=1

In this case your normally will configure MySQL running into SLAVE server with read-only=1, as showed below:
.
mysql> SET GLOBAL read_only=1;
.
Topology 2: Multiple
.
As the name says, on this topology we can have many servers looking for a unique MASTER, building what we know as a multiple topology. It will be pretty suitable when the environment has the necessity to advance to a multiple divided workload, which on you can let you app write data on MASTER, read from one of the SLAVEs servers (you can apply a kind of load-balancing as mysql-proxy or F5 LTM) and let the other to extract security copies to avoid interfere on those production servers. It is a common situation where we have high workload and must backup databases at least two times a day – in this case it is good to use the snapshot backup supported by MySQL Enterprise Backup, Xtrabackup or Zmanda.

You could set up much more servers than two depicted above!

Topology 3: Chain
This topology will simply provide that story of replicate data on Master(1) <- Master/Slave(2) <- Slave(3) architecture. This is good when you have a departmental servers available separately inside your organization to attend many areas with as less time as possible. With this topology replication model, you will be able to adjust applications to write data on server A and B (INSERT and DELETE), scaling writes using both mentioned servers. The third one could be used to serve reports and backup as a read only server (just SELECT). What we cannot forget is to set the log-slave-updates on server’s B my.cnf due to this server will be MASTER and SLAVE at the same time (MySQL Manual Page: http://bit.ly/nGTQO1).

rpl_chain

MASTER(A) <-> MASTER(B) -> SLAVE(C) - Attention to configure out -log-slave-updates on server (B)

Normally, a slave does not log to its own binary log any updates that are received from a master server. This option tells the slave to log the updates performed by its SQL thread to its own binary log. For this option to have any effect, the slave must also be started with the --log-bin option to enable binary logging. --log-slave-updates is used when you want to chain replication servers. For example, you might want to set up replication servers using this arrangement:

A -> B -> C

Here, A serves as the master for the slave B, and B serves as the master for the slave C. For this to work, B must be both a master and a slave. You must start both A and B with --log-bin to enable binary logging, and B with the --log-slave-updates option so that updates received from A are logged by B to its binary log.

Topology 4: Circular

This kind of replication topology has been generating many discussion around MySQL environments due to the set up with MySQL 5.0, version that not count with the terminator applied on MySQL 5.1. On broad terms, MySQL servers is set up on a circular way where every server is MASTER and SLAVE at the same time. The log-slave-updates replication system variables must be configured on all servers in order to ignore servers that just have executed that current updates.

rpl_circular

You can set up MySQL Servers 5.1 ++ in circular replication as A <-> B <-> C

In circular replication, it was sometimes possible for an event to propagate such that it would be replicated on all servers. This could occur when the originating server was removed from the replication circle and so could no longer act as the terminator of its own events, as normally happens in circular replication.

To prevent this from occurring, a new IGNORE_SERVER_IDS option is introduced for the CHANGE MASTER TO statement. This option takes a list of replication server IDs; events having a server ID which appears in this list are ignored and not applied.

In conjunction with the introduction of IGNORE_SERVER_IDS, SHOW SLAVE STATUS has two new fields. Replicate_Ignore_Server_Ids displays information about ignored servers. Master_Server_Id displays the server_id value from the master. (Bug #47037)

See also Bug #25998, Bug #27808.

Additional Resources

White Papers

On Demand Webinars

AddThis Social Bookmark Button

MySQL 5.6 and the new MySQL Partitioning resources

novembro 8th, 2011 | by: Bianchi | Posted in: MySQL A&D | No Comments »

There are lots of new features on MySQL 5.6 related to the MySQL Partition Engine that we can apply on database tables. With MySQL new version, besides the performance improvements provided by the partitioned tables (which resource we have since MySQL 5.1), the database administrators might improve their environments architecture & design in order to better retrieve information selecting data just from the specific table partition – partition pruning.

We will start this post creating a table that will store data from the product payment system’s process and it will be partitioned using the RANGE() partition function with the MONTH() function nested. If you want to know more about partitioned tables using the RANGE() partition function, click here (a post written in Portuguese).

Scenario

Imagine you’re developing a new database to support a system responsible to be the interface with sales department. Obviously, that system must be as faster as it can to get round expending customers time or lose the opportunity to sell more products (generally sales guys are very greedy and the organization platform systems must support them). With this point in mind, we’ll create the following [example] table in order to fit some performance requirements using a partitioning example by month():

[root@innodbserver mysql]# mysql -u root
Welcome to the MySQL monitor.
Your MySQL connection id is 1
5.6.2-m5-log MySQL Community Server (GPL)

mysql> use test
Database changed

mysql> CREATE TABLE t1 (
    -> id int not null auto_increment,
    -> value decimal(10,2) not null,
    -> payment_date datetime not null,
    -> PRIMARY KEY(id,payment_date)
    -> ) PARTITION BY RANGE(MONTH(payment_date)) (
    -> PARTITION p0 VALUES LESS THAN(02),
    -> PARTITION p1 VALUES LESS THAN(03),
    -> PARTITION p2 VALUES LESS THAN(04),
    -> PARTITION p3 VALUES LESS THAN(05),
    -> PARTITION p4 VALUES LESS THAN(06),
    -> PARTITION p5 VALUES LESS THAN(07),
    -> PARTITION p6 VALUES LESS THAN(08),
    -> PARTITION p7 VALUES LESS THAN(09),
    -> PARTITION p8 VALUES LESS THAN(10),
    -> PARTITION p9 VALUES LESS THAN(11),
    -> PARTITION P10 VALUES LESS THAN(MAXVALUE)
    -> );
Query OK, 0 rows affected (5.73 sec)

Let’s load some data into the table so as we can work with some partitioning features. Perhaps soon I may update this post with a stored procedure to populate table’s partitions in a WHILE loop.

insert into test.t1 set id=null, value='1.00', payment_date=date_sub(now(), interval 1 month);
insert into test.t1 set id=null, value='2.00', payment_date=date_sub(now(), interval 2 month);
insert into test.t1 set id=null, value='3.00', payment_date=date_sub(now(), interval 3 month);
insert into test.t1 set id=null, value='4.00', payment_date=date_sub(now(), interval 4 month);
insert into test.t1 set id=null, value='5.00', payment_date=date_sub(now(), interval 5 month);
insert into test.t1 set id=null, value='6.00', payment_date=date_sub(now(), interval 6 month);
insert into test.t1 set id=null, value='7.00', payment_date=date_sub(now(), interval 7 month);
insert into test.t1 set id=null, value='8.00', payment_date=date_sub(now(), interval 8 month);
insert into test.t1 set id=null, value='9.00', payment_date=date_sub(now(), interval 9 month);
insert into test.t1 set id=null, value='10.00', payment_date=date_sub(now(), interval 10 month);
insert into test.t1 set id=null, value='11.00', payment_date=date_sub(now(), interval 11 month);
insert into test.t1 set id=null, value='12.00', payment_date=date_sub(now(), interval 12 month);

And now, the new resource supported in MySQL 5.6 – how to retrieve data from partitioned table selecting rows just from a specific partition:

mysql> select id, concat('R$ ',value) as amount, payment_date from test.t1 partition(p5);
+----+---------+---------------------+
| id | amount  | payment_date        |
+----+---------+---------------------+
| 1  | R$ 1.00 | 2014-06-22 21:19:26 |
+----+---------+---------------------+
1 row in set (0.00 sec)

You can check existing partition names, expressions and current rows querying INFORMATION_SCHEMA.PARTITIONS table:

mysql> select table_schema, table_name, partition_name, table_rows
    -> from information_schema.partitions where table_name='t1' and table_schema='test'\g
+--------------+------------+----------------+------------+
| table_schema | table_name | partition_name | table_rows |
+--------------+------------+----------------+------------+
| test         | t1         | p0             |          1 |
| test         | t1         | p1             |          1 |
| test         | t1         | p2             |          1 |
| test         | t1         | p3             |          1 |
| test         | t1         | p4             |          1 |
| test         | t1         | p5             |          1 |
| test         | t1         | p6             |          1 |
| test         | t1         | p7             |          1 |
| test         | t1         | p8             |          1 |
| test         | t1         | p9             |          1 |
| test         | t1         | P10            |          2 |
+--------------+------------+----------------+------------+
11 rows in set (0.00 sec)

I created a table partitioned by RANGE() partition function and it is using the MONTH() MySQL built-in function nested, which will become impossible MySQL Partition Engine to use the engine resource called Partitioning Pruning. It is true, but, since we are stating from what partition it will retrieve data, partition pruning doesn’t care in this case. To have better results, I’ll insert some new rows into the created table and then, I’ll SELECT rows from table using EXPLAIN in two scenarios, (1) it will read rows from a specific partition to force the partition pruning resource and (2) it will read rows from all partitions – you’ll check this observing the output of the EXPLAIN PARTITIONS…

See this below:

#
#: selecting rows from all partitions
#
mysql> explain partitions select id, concat('R$ ', value) as amount, payment_date from test.t1 order by value\G
*************************** 1. row ***************************
           id: 1
  select_type: SIMPLE
        table: t1
   partitions: p0,p1,p2,p3,p4,p5,p6,p7,p8,p9,P10
         type: ALL
possible_keys: NULL
          key: NULL
      key_len: NULL
          ref: NULL
         rows: 12
        Extra: Using filesort
1 row in set (0.00 sec)

#
#: selecting rows from a specific partition - partition pruning
#
mysql> explain partitions select id, concat('R$ ', value) as amount, payment_date from test.t1 partition(p6)\G
*************************** 1. row ***************************
           id: 1
  select_type: SIMPLE
        table: t1
   partitions: p6
         type: ALL
possible_keys: NULL
          key: NULL
      key_len: NULL
          ref: NULL
         rows: 2
        Extra: NULL
1 row in set (0.00 sec)

This resource or feature can be considered by the database administrator to improve the database design and queries’ performance. It’s much better to select rows from a single partition than scan all the index or table searching for rows. Not just for SELECT, but when one thinks about a good strategy for data purge or move a slice of the table’s data to a history database, it’s possible to just exchange partition among partitioned tables or even drop/truncate it.

mysql> alter table test.t1 drop partition p10;
Query OK, 0 rows affected (1.71 sec)
Records: 0  Duplicates: 0  Warnings: 0

mysql> select table_name, partition_name from information_schema.partitions where table_name='t1' and table_schema='test';
+------------+----------------+
| table_name | partition_name |
+------------+----------------+
| t1         | p0             |
| t1         | p1             |
| t1         | p2             |
| t1         | p3             |
| t1         | p4             |
| t1         | p5             |
| t1         | p6             |
| t1         | p7             |
| t1         | p8             |
| t1         | p9             |
+------------+----------------+
10 rows in set (0.01 sec)

As you can see, we can force the partition pruning when using named partitions on SELECT through the functions PARTITION(). This feature is planned to MySQL 5.6 and you can download that version from MySQL Labs ->http://labs.mysql.com/

Tags: , , , , , ,

AddThis Social Bookmark Button