I’d like to start this post or entry registering that even SSD cards or disks provides very low latency and faster random reads/writes, I consider that it’s new to MySQLers and at least on MySQL World. New based on the information we can find on the internet in form of collaboration to make it to run maybe “like a charm” and by the presentations we’ve been seeing more and more on the last months. Things like SLC and MLC have been better explained now than before and what I’ve seen is that MySQL Team has collaborate a lot with all these *new* things to make the software of MySQL to scale more in terms of I/O usage, delivering better results in terms simple SELECT queries to heavy ALTER TABLE. What I’ve waited when SSD come into a plan of a special customer I’m working with in Brazil is that all the queries could perform better just by being over faster disks – this is not true. Many tests have been done where I’m using sysbench 0.5 and more than table as discussed on twitter with @cpeintre, @morgo and @stoker. Sysbench results will be on focus soon in this post.
Presenting, Dell Compellent SC8000, the storage!
My first desire was to have Fusion IO cards to run some MySQL’s files on that, to make it easier as the market is doing that since some time ago. I’ve seen for years many guys speaking about those flash cards delivering lots of IOPS and making MySQL run faster. BTW, when our Dell’s contact presented the Dell Compellent SC8000, we saw the possibility to expand the IT environment towards a more professional environment and due to the possibility to scale the hardware in case we need to provide more space on our database layer. This storage, aka “external storage” represents a large investment and a giant step in terms of environment professionalism and was thought like a something that will provide all the needed IOPS and speed we need to solve problems of queries to feed reports to replication lags that happens with no sense (we can go into details of it later on another post). Detailing so the storage, it has an intelligence to always write on SLC flash disks organized in RAID 10 (tier 1), always read from MLC flash disks organized in RAID 5 (tier 2) and not accessed data/pages are moved *initially* in 12 days to the 10k mechanic disks in RAID 6 which is the tier 3.
Additionally, the tier 2 is the hot area where all the more accessed data resides. When a data is inserted into the database, it’s moved to tier 2 in background and if not accessed, moved away to mechanical disks, less privileged area. It seems to me that internally this storage has a kind of hash table with all the pages contained on the hot area, that is, tier 2, and from times to times it is going to move the less accessed pages. In case of tier 2 gets full, less accessed pages will be moved to tier 3 before the 12th day. Basically, once can choose a profile to create a new LUN. This profile can be comprised by tier 1 only, tier 2 only, tier 3 only or any combination among them. The connectivity among storage and servers is done by a dedicated fiber channel network, using a HBA of 8GB Dual Port (round-robin).
Nice…it’s flexible. More here…
Test with FIO
Theoretically, all those things seemed OK and we went for a test for FIO. The test went very well, and it’s just create a LUN with a profile such as “automatic”, containing all the existent tiers and mount it on a Linux machine, which is Red Hat 6.5. After writing a configuration file to be read by FIO simulating what MySQL does on our environment, it was executed on both scenarios: (NDB2) our server running all MySQL files on HDD, (NDB3) on the other server running MySQL files on SSD. The FIO script is that below:
[random-writes]
; this test was written by Bianchi
; me at wagnerbianchi.com
runtime=1800 # 30mins
size=2G
threads=1
numjobs=16
ioengine=libaio
iodepth=32
bs=5k
; innodb related stuff
lockfile=readwrite # simulating row-locking
rw=randwrite       # writing in pages randomly
direct=0           # O_DSYNC
sync=0             # O_DSYNC
refill_buffers     # Buffer Pool load pages
openfiles=1000
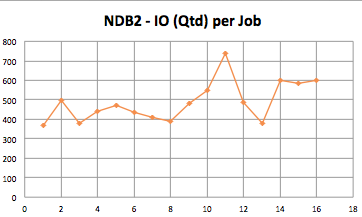
My intention configuring direct=0 and sync=0 was to perform the same thing we have on our current production environment, deliver all the writes to a battery backed cache and get back. The test results:
Server Job # IO (MB) IO (Qtd) TIME (ms)
NDB2     1   1965.4       368   1091316
NDB2     2   2047.2       498    841042
NDB2     3   2047.2       380   1103541
NDB2     4   1704.3       443    787271
NDB2     5   2047.2       471    889231
NDB2     6   2015.6       434    951029
NDB2     7   2047.2       411   1020253
NDB2     8   2047.2       387   1081822
NDB2     9   2047.2       481    870714
NDB2    10   2011.1       549    749626
NDB2    11   1633.6       740    452040
NDB2    12   2047.2       488    858940
NDB2    13   2047.2       378   1107883
NDB2    14   1945.6       602    661052
NDB2    15   2047.2       585    716770
NDB2    16   2000.9       601    680994
Server  Job # IO (MB) IO (Qtd) TIME (ms)
STORAGE     1  1965.4     2115    190270
STORAGE     2  2047.2     2925    143387
STORAGE     3  2047.2     3212    130562
STORAGE     4  1704.3     2910    119915
STORAGE     5  2047.2     3010    139334
STORAGE     6  2015.6     2138    193032
STORAGE     7  2047.2     3073    136465
STORAGE     8  2047.2     2791    150233
STORAGE     9  2047.2     2415    173628
STORAGE    10  2011.1     3027    136085
STORAGE    11  1633.6     2186    153012
STORAGE    12  2047.2     2700    155319
STORAGE    13  2047.2     2779    150917
STORAGE    14  1945.6     2886    138059
STORAGE    15  2047.2     2785    150573
STORAGE    16  2000.9     2865    142991
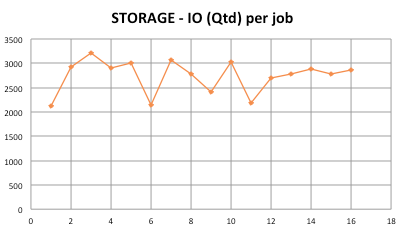
While IOPS are a way more on SSD, latency behavior is a way less. Next step was to setup everything and get the storage working inside our main DC and mount a LUN on some server to carry on with tests. The first sysbench I ran was was using Percona Server 5.5.37.1 and even configuring innodb_adaptive_flush_method as keep_average, neighbor pages as area and changing the redo logs block size to 4096, MySQL wasn’t able to use all the I/O we were waiting. it was a time that, speaking with @morgo, the version upgrade come into the scene and I went for it. The only barrier I had upgrading the 5.5 to 5.6 was the question around temporal data types we discussed with some folks on the Official MySQL Forum. Even having the replication between 5.5.37 (master prod) and 5.6.21 (new comer slave with SSD) running well for more than 10 hours, I decided to apply the solution proposed by Johnaton Coombes. It’s running well until now…
Sysbench’ing
After seeing that the storage really deliver what we’re looking for to check what’s the best configuration to put MySQL to run on SSD. After reading the Matsunobu entry on his blog, I rearranged everything considering sequential written files on HDD and just tables and the shared tablespace on SSD (however it’s possible to put undo files on SSD and all other things of ibdata1 on HDD). That gave me new numbers and replication gained more throughput having relay logs accompanied by redo logs, error log and slow query logs. Thanks for @cpeintre to give a hint to have more than one table to sysbench situations and for @lefred to host sysbench rpm package on his blog (it’s nice).
innodb_flush_method and innodb_flush_logs_at_trx_commit
At this time I’ve started some tests to consider the best combination of some important parameters to better handle the InnoDB workflow. On my current environment using mechanic disks, I’ve configured mysqld to use more and more memory and file system cache, taking into account that my underlying hardware relies on some disk controllers with battery backed cache of 512MB – this permits my whole system to deliver almost 9.300K IOPS using RAID 1. My intention here is to test innodb_flush_logs_at_trx_commit as 1 when flush_method is O_DIRECT and innodb_flush_logs_at_trx_commit {0|2} when flush_method is O_DSYNC – I’d like to remember that I’m using MySQL Oracle.
Considering that O_DSYNC and flush_method as 0|2 had the same results…
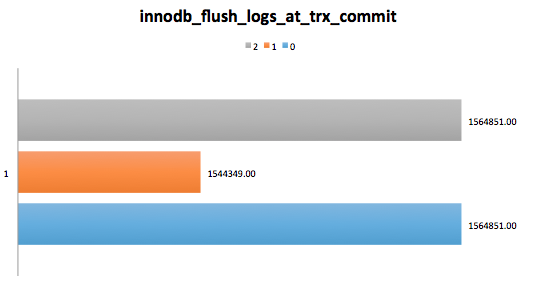
Let’s benchmark it so.
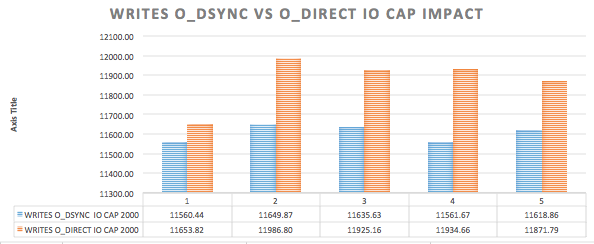
--innodb_io_capacity=2000
--innodb_lru_scan_depth=2500
--innodb_flush_logs_at_trx_commit=1
--innodb_flush_method=O_DIRECT
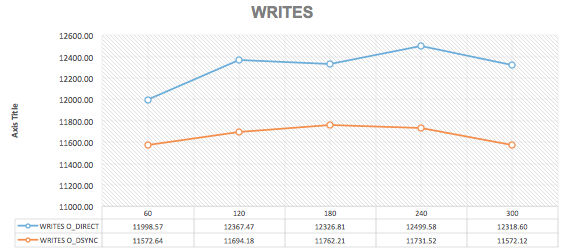
--innodb_io_capacity=2000
--innodb_lru_can_depth=2500
--innodb_flush_logs_at_trx_commit=0
--innodb_flush_method=O_DSYNC
 The final summary was:
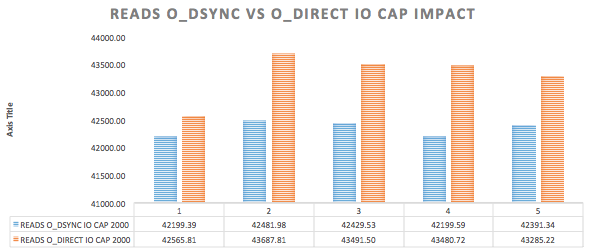
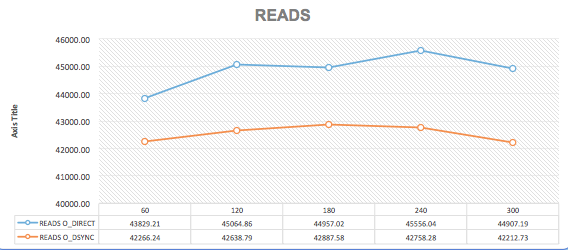
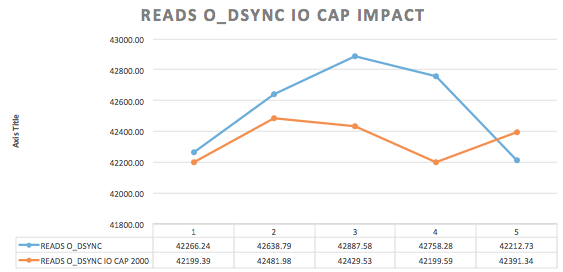
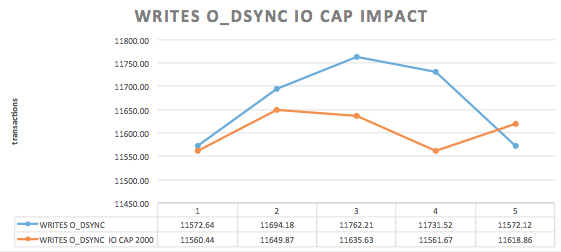
innodb_io_capacity and innodb_lru_scan_depth
After reading the blog entry written by Mark Callaghan on 2013 about these both system variables, I decided to have the value on both as a start point. As it’s well explained by Mark on his blog entry and using twitter, as here, both variables will give mysqld more IOPS if there are more resources like that on the system. So I went form 1000 to 3000 to make it reasonable for io_capacity and did the same for lru_scan.
#: Sysbench line used here:

[bianchi@ndb2 db]$ sudo sysbench --test=oltp.lua --oltp-table-size=1000000 --mysql-db=test --oltp-tables-count=10 --mysql-user=bianchi --db-driver=mysql --mysql-table-engine=innodb --max-time=300 --max-requests=0 --report-interval=60 --num-threads=500 --mysql-socket=/var/mysql/logs/mysql.sock --mysql-engine-trx=yes run
1-) "select @@innodb_io_capacity, @@innodb_lru_scan_depth, @@innodb_buffer_pool_instances;"
+----------------------+-------------------------+--------------------------------+
| @@innodb_io_capacity | @@innodb_lru_scan_depth | @@innodb_buffer_pool_instances |
+----------------------+-------------------------+--------------------------------+
|                 1000 |                    1000 |                              8 |
+----------------------+-------------------------+--------------------------------+
[  60s] threads: 500, tps: 2895.09, reads/s: 43241.46, writes/s: 11824.06, response time: 1278.56ms (95%)
[ 120s] threads: 500, tps: 2919.87, reads/s: 43432.81, writes/s: 11914.27, response time: 1387.02ms (95%)
[ 180s] threads: 500, tps: 2911.20, reads/s: 43266.95, writes/s: 11875.58, response time: 1397.43ms (95%)
[ 240s] threads: 500, tps: 2896.17, reads/s: 43039.52, writes/s: 11812.63, response time: 1385.36ms (95%)
[ 300s] threads: 500, tps: 2881.70, reads/s: 42842.40, writes/s: 11756.67, response time: 1382.87ms (95%)

2-) "select @@innodb_io_capacity, @@innodb_lru_scan_depth, @@innodb_buffer_pool_instances;"
+----------------------+-------------------------+--------------------------------+
| @@innodb_io_capacity | @@innodb_lru_scan_depth | @@innodb_buffer_pool_instances |
+----------------------+-------------------------+--------------------------------+
|                 2000 |                    2000 |                              8 |
+----------------------+-------------------------+--------------------------------+
[  60s] threads: 500, tps: 2834.36, reads/s: 42276.71, writes/s: 11570.30, response time: 1293.57ms (95%)
[ 120s] threads: 500, tps: 2964.74, reads/s: 44071.70, writes/s: 12094.58, response time: 1383.70ms (95%)
[ 180s] threads: 500, tps: 2943.48, reads/s: 43790.31, writes/s: 12011.63, response time: 1380.39ms (95%)
[ 240s] threads: 500, tps: 2940.23, reads/s: 43772.47, writes/s: 12002.10, response time: 1381.63ms (95%)
[ 300s] threads: 500, tps: 2961.58, reads/s: 44007.70, writes/s: 12079.94, response time: 1376.67ms (95%)

3-) "select @@innodb_io_capacity, @@innodb_lru_scan_depth, @@innodb_buffer_pool_instances;"
+----------------------+-------------------------+--------------------------------+
| @@innodb_io_capacity | @@innodb_lru_scan_depth | @@innodb_buffer_pool_instances |
+----------------------+-------------------------+--------------------------------+
|                 2000 |                    4000 |                              8 |
+----------------------+-------------------------+--------------------------------+
[  60s] threads: 500, tps: 2835.78, reads/s: 42283.84, writes/s: 11577.04, response time: 1287.78ms (95%)
[ 120s] threads: 500, tps: 2866.35, reads/s: 42659.13, writes/s: 11697.75, response time: 1418.51ms (95%)
[ 180s] threads: 500, tps: 2901.80, reads/s: 43129.23, writes/s: 11834.54, response time: 1383.28ms (95%)
[ 240s] threads: 500, tps: 2924.12, reads/s: 43527.28, writes/s: 11934.51, response time: 1394.09ms (95%)
[ 300s] threads: 500, tps: 2928.04, reads/s: 43537.30, writes/s: 11946.43, response time: 1390.76ms (95%)

4-) "select @@innodb_io_capacity, @@innodb_lru_scan_depth, @@innodb_buffer_pool_instances;"
+----------------------+-------------------------+--------------------------------+
| @@innodb_io_capacity | @@innodb_lru_scan_depth | @@innodb_buffer_pool_instances |
+----------------------+-------------------------+--------------------------------+
|                 2000 |                    3000 |                              8 |
+----------------------+-------------------------+--------------------------------+
[  60s] threads: 500, tps: 2915.01, reads/s: 43438.88, writes/s: 11896.84, response time: 1276.65ms (95%)
[ 120s] threads: 500, tps: 3003.12, reads/s: 44634.98, writes/s: 12248.90, response time: 1345.71ms (95%)
[ 180s] threads: 500, tps: 2983.62, reads/s: 44394.64, writes/s: 12174.23, response time: 1372.15ms (95%)
[ 240s] threads: 500, tps: 2971.40, reads/s: 44181.10, writes/s: 12122.10, response time: 1361.10ms (95%)
[ 300s] threads: 500, tps: 2976.20, reads/s: 44241.53, writes/s: 12140.61, response time: 1360.70ms (95%)

5-) "select @@innodb_io_capacity, @@innodb_lru_scan_depth, @@innodb_buffer_pool_instances;"
+----------------------+-------------------------+--------------------------------+
| @@innodb_io_capacity | @@innodb_lru_scan_depth | @@innodb_buffer_pool_instances |
+----------------------+-------------------------+--------------------------------+
|                 2000 |                    2500 |                              8 |
+----------------------+-------------------------+--------------------------------+
[  60s] threads: 500, tps: 2915.46, reads/s: 43605.14, writes/s: 11914.68, response time: 1207.51ms (95%)
[ 120s] threads: 500, tps: 2993.02, reads/s: 44541.72, writes/s: 12214.99, response time: 1358.26ms (95%)
[ 180s] threads: 500, tps: 3004.48, reads/s: 44628.71, writes/s: 12254.80, response time: 1346.52ms (95%)
[ 240s] threads: 500, tps: 3014.33, reads/s: 44839.96, writes/s: 12298.70, response time: 1366.41ms (95%)
[ 300s] threads: 500, tps: 2974.83, reads/s: 44291.42, writes/s: 12142.27, response time: 1357.04ms (95%)
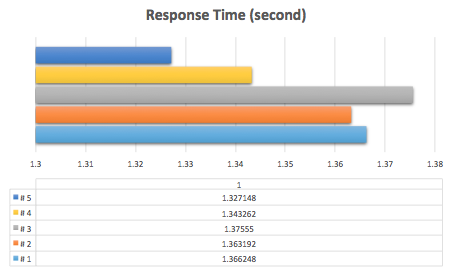
Summarizing the above collected facts, in terms of…
Response Times
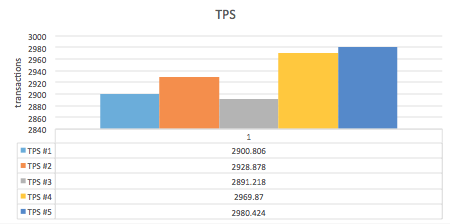
TPS
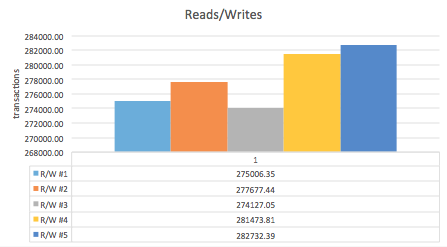
Reads/Writes
innodb_log_buffer_size
This was configured used a large value and it was annoying me a little. After fiding the Shlomi Noach blog entry with a good query to check the size of transactions that populate the log buffer, its seems very important to have in place a more accurate configuration.
ndb2 mysql> SELECT
    ->   innodb_os_log_written_per_minute*60
    ->     AS estimated_innodb_os_log_written_per_hour,
    ->   CONCAT(ROUND(innodb_os_log_written_per_minute*60/1024/1024, 1), 'MB')
    ->     AS estimated_innodb_os_log_written_per_hour_mb
    -> FROM
    ->   (SELECT SUM(value) AS innodb_os_log_written_per_minute FROM (
    ->     SELECT -VARIABLE_VALUE AS value
    ->       FROM INFORMATION_SCHEMA.GLOBAL_STATUS
    ->       WHERE VARIABLE_NAME = 'innodb_os_log_written'
    ->     UNION ALL
    ->     SELECT SLEEP(60)
    ->       FROM DUAL
    ->     UNION ALL
    ->     SELECT VARIABLE_VALUE
    ->       FROM INFORMATION_SCHEMA.GLOBAL_STATUS
    ->       WHERE VARIABLE_NAME = 'innodb_os_log_written'
    ->   ) s1
    -> ) s2
    -> \G
*************************** 1. row ***************************
   estimated_innodb_os_log_written_per_hour: 1008476160
estimated_innodb_os_log_written_per_hour_mb: 961.8MB
1 row in set (59.99 sec)

ndb2 mysql> SELECT (961.8/60)\G
*************************** 1. row ***************************
(961.8/60): 16.03000
1 row in set (0.00 sec)
Operating System Demanding Tuning
All machine servers planned to be placed upon the storage runs the Red Hat 6.5. After updating the operating systems packages we followed the recommendations of this paper released by Oracle , differing just the scheduler/elevator which we decided to use [NOOP]. In the midst of the configuration path that has run for some days, we had a case when we forgot to make this below configuration and we had a chance to see the the performance has improved by 30%, considering replication lagging and query executions for reads and writes. As the storage attached/mounted on file system is represented by an alias or device mapper (appears as dm-X) for all the underlying disks, it’s possible to configure just the device mappers in order to make all these things to work properly with NOOP.
$ echo 10000 > /sys/block/sdb/queue/nr_requests
$ echo 1024 > /sys/block/sdb/queue/max_sectors_kb
$ echo 0 > /sys/block/sdb/queue/rotational
$ echo 0 > /sys/block/sdb/queue/add_random
$ echo 0 > /sys/block/sdb/queue/rq_affinity
You can check the meaning of each configuration here on the Red Hat’s Knowledge Base. Additionally, it was very interesting to place all the above configuration on /etc/rc.local.
Replication Lagging Problems
OK, the scenario #5 is the best at all. So, my feelings are that in some point all those benchmarks done with sysbench lied completely! When I configured my server on SSD and get it replicating, catching up on master data, the lagging wasn’t decreased after an hour. Instead, the lagging increased and the slave server was getting far and far from master, almost fading away on the road. Thinking about the configuration I’ve got on my stablished environment, I decided to set it up as O_DSYNC, relying on the file system cache and storage controller battery backed cache (64GB), configuring innodb_flush_logs_at_trx_commit as 0 as well. Things started getting a little bit more faster since the lagging was stopped on the same number of Seconds_Behind_Master. Ok, I made this fucking thing to decrease when I tuned well the innodb_log_buffer_size as I told on some sections above and then replication lags disappeared, being this new server the only server that stays always behind the red state of lagging which is 50 seconds (our company threshold). First of all I configured log_buffer as 8M, but, checking properly status variables, I saw many pending syncs accumulating there. Jumped to 32M and now everything is OK. Next step as I’m running 5.6 now is to jump into this party and start using PERFORMANCE_SCHEMA and other smart things to monitor the environment in order to increase throughput and get even less response time.
By the way, until this point, I’ve run MySQL 5.6.21 with this below configuration file and Linux adjusts previously mentioned:
--innodb_io_capacity=2000
--innodb_io_capacity_max=2500
--innodb_lru_scan_depth=2500
--innodb_flush_log_at_trx_commit=2
--innodb_flush_neighbors=0
--innodb_log_group_home_dir=/var/mysql/logs
--innodb_log_files_in_group=2
--innodb_log_file_size=1024M
--innodb_buffer_pool_size=72G
--innodb_doublewrite=1
--innodb_buffer_pool_instances=10
--innodb_log_buffer_size=32M
--innodb_file_per_table=1
--innodb_file_format=BARRACUDA
--innodb_flush_method=O_DSYNC
--innodb_open_files=900000
--innodb_read_io_threads=16
--innodb_write_io_threads=16
--innodb_support_xa=0
The final comment is that when running MySQL on SSD, 5.5 is the worst case and the 5.6 make the kid a little bit better at this moment when the charts related with I/O started getting more colored in Ganglia and in the Enterprise Manager which is the storage’s monitoring center. Speaking about 5.6 yet is good to have attention on two variables which are innodb_lru_scan_depth which will handle all the I/O per Buffer Pool instance and innodb_flush_neighbors which will handle the way flush pages are done on SSD. I believe that soon I’ll have more to post here considering performance tuning related things.


